You can create a multi-cell
graph that has a scatter plot matrix layout. Here is an example of
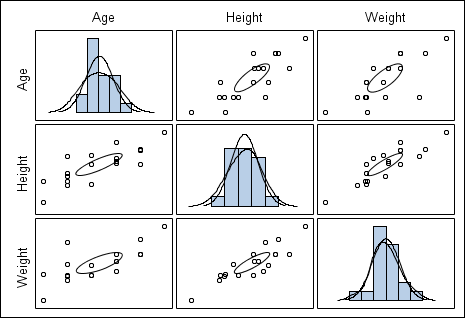
a scatter plot matrix:
Here are the characteristics
of scatter plot matrices:
-
The matrix is a data-driven graph
based on matrix variables.
-
The diagonal cells can be populated
with a histogram and up to two density plots.
-
The non-diagonal cells contain
a scatter plot for the crossing variables with an optional mean or
prediction ellipse.
-
You can change the properties of
a scatter plot matrix as follows:
-
You cannot change the properties
of the histograms, density plots, and ellipses.
-
You can change the marker properties
for the scatter plots. When you change the marker properties, the
change is applied to all non-diagonal cells.
-
You can change the transparency
of all plots.
-
You can change the outline and
background properties of the graph.
For more information,
see the sections on changing graph and plot properties.