Adding Legends

About Legends

A graph can have multiple legends. There are two main categories of legends:
Cell legend
applies to the plots within a cell. By default, a cell legend contains all plots in the cell. There are two types of cell legends:
  • You can add a discrete legend to any of the cells in a graph. A discrete legend is created within the cell.
  • If the plot is a contour plot with a contour type of fill or gradient, then you can add a gradient legend to the cell. A gradient legend appears alongside the contour plot.
Global legend
applies to all cells in a multi-cell graph. You specify which plots you want in the legend when you create the legend.

Add a Cell Legend

To add a legend to a cell, click and drag the appropriate legend icon from the Insets panel to the cell.
Discrete Legend icon
To add a discrete legend, click and drag the Discrete Legend icon to the cell. The legend is placed near the location where the icon was dropped. By default, all plots in the cell are displayed in the legend.
Gradient Legend icon
If the plot is a contour plot with a contour type of fill or gradient, then click and drag a Gradient Legend icon to the cell. The gradient legend is displayed on the right side of the cell.
You can also right-click inside a graph cell and choose Add an Element. Then click the legend icon from the Elements pop-up window.

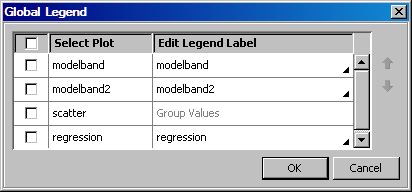
Add a Global Legend to a Graph

A global legend applies to all the cells in the graph. You specify which plots you want in the legend when you create the legend.
To add a global legend to a graph:
  1. Select Insertthen selectGlobal Legend, or click Global legend icon in the toolbar. The Global Legend dialog box opens. The dialog box contains a list of all the plots and lines in all the cells of the graph.
    Global Legend dialog box
  2. Select the check box next to each plot that you want to include in the legend. If you have multiple plots and want to include all plots, select the check box in the heading of the first column.
  3. To edit a label, do the following:
    1. Double-click the label.
    2. Enter the text that you want.
    You can edit a label if a small triangle small triangle appears next to the label. When the Edit Legend Label contains the text Group Values for a plot, then the values included in the legend come from a group variable and cannot be edited.
  4. Specify the order in which plots appear in the legend as follows:
    1. Click a plot name to select it.
    2. To move the plot up or down in the list, click the Move Up Arrow up icon or Move Down Arrow down icon arrow.
  5. Click OK. The legend appears at the bottom of the graph. To move the legend, see Reposition a Legend.