Specifying Style Elements for Plot Properties
ODS styles
control the default color schemes and visual attributes for a graph.
ODS styles consist of style elements, and each style element has its
own attributes. When you modify graphics properties, you often have
the option to specify a style element. For example, you can select
a style element when you change the properties of plot lines, fills,
and markers. The visual properties of the item that you modify are
obtained from the specified style element.
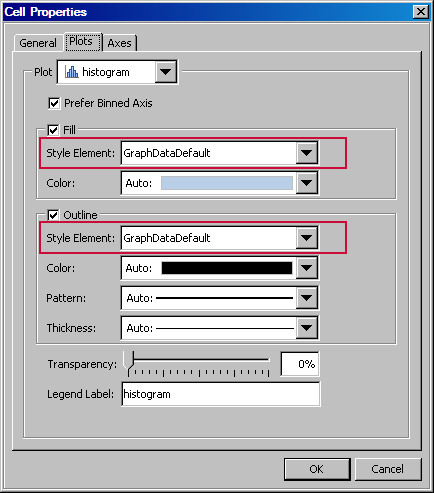
The style
element determines the specific attributes of the plot, such as the
outline color, pattern, and thickness. The default value for those
attributes is Auto, which indicates that
the value is automatically derived from the selected style element.
If you select a different style element, the automatic attributes
change.
In the
example, you can select another style element from the list box. Alternatively,
you can specify the plot fill and outline attributes explicitly by
selecting a value other than Auto from the
list boxes.
When you
explicitly change an item’s attributes, the change persists
regardless of the style. If you later change the style element or
the graph's style, your explicit settings override the new style element
or style.
Note: Plot elements
might have a Group value instead of an Auto value. The Group value
indicates that the value is derived from the group variable if one
has been defined for the plot.