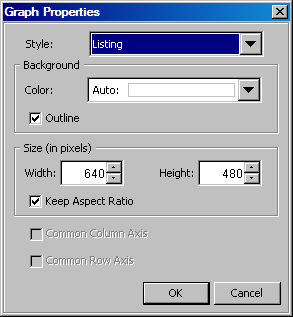
Change the Style That Is Applied to a Graph
ODS styles
control the default color schemes and visual attributes for a graph.
You can change the overall appearance of a graph by changing the applied
style.
As an
alternative to this method, you can select the graph, select Format Style, and then select the style that you want from the
cascading menu.
You can
change the style that is applied to your graphs by default. For instructions, see Setting Preferences.

