Each cell
can contain multiple plots and insets. Plots and insets are rendered
in the order in which they are added to a cell as follows:
-
Plots are stacked, with the last
one added on top.
-
Insets (legends and text entries)
are always rendered on top of plots. Among themselves, insets and
text entries are stacked, with the last one added on top.
You can
change the order in which these items are stacked.
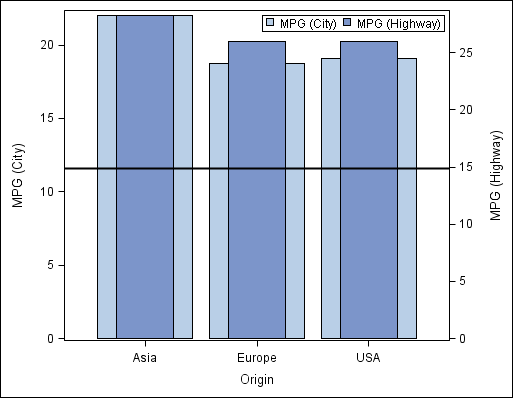
For example,
suppose that you create a graph with two bar charts, and then add
a line. The line was added last, so it appears in front of the bar
charts.
Now suppose
that you want the line to be in front of the City plot but behind
the Highway plot. You can make this change by modifying the cell contents.
To change
the order of plots and insets:
-
Right-click
in the cell and select
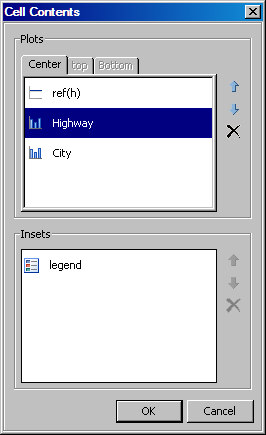
Cell Contents. The
Cell Contents dialog box opens.
Note: The contents
of the Cell Contents dialog box vary depending on the plots and insets
that are in the graph cell.
There
are two main sections in the dialog box:
-
The upper panel shows the list
of plots that currently exist in the cell. The plots are ordered so
that the plot that was added last appears at the top of the list.
-
The bottom panel shows the list
of insets such as legends and entries. These items are always rendered
on top of the plots, but are ordered among themselves. The item that
was added last appears at the top of the list.
-
To move
an item up or down in the list, select the item and then click the
Move Up

or Move Down

arrow.
In the
example, you would move the Highway item up so that it is on top.
-
To delete
an item, select the item and then click the Delete

icon.
-
If applicable,
select the
Top or
Bottom tab and make changes there.
The
Top or
Bottom tab is available when the cell contains a block plot that is positioned in
the top or bottom margin of the graph. On these tabs, you can move
or delete plots.
-
When you
are finished making changes, click
OK.
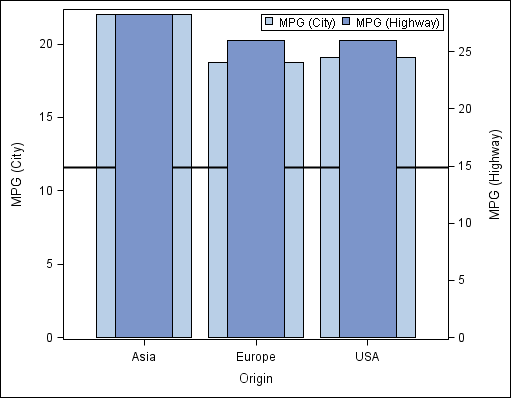
In the
example, the line is in front of the City plot but behind the Highway
plot.
Line Is Between the Plots