Examples of Using the Procedures
SGPLOT Examples
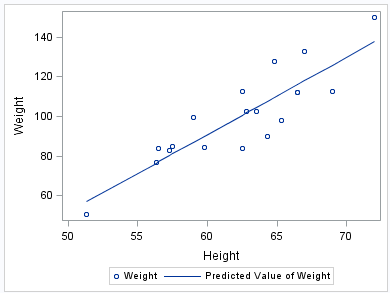
Example Fit Plot
If you calculate a custom
fit for your data, you might use a series plot to render the fit.
The following PROC SGPLOT example combines a scatter and a series
plot, and uses the SASHELP.CLASSFIT data set.
proc sgplot data=sashelp.classfit  noautolegend;
scatter x=height y=weight;
series x=height y=predict;
run;
Example Bar Chart
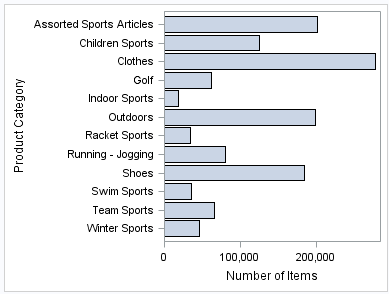
In the SGPLOT procedure,
the HBAR statement specifies the plot to be displayed, which in this
case is a horizontal bar chart. In addition, the statement specifies
the response variable (Number of Items) to be displayed on the horizontal
axis. The response variable is optional. If you do not provide a response
variable, then the chart shows the frequency count on the horizontal
axis. The statement also specifies the statistic for the horizontal
axis. The STAT= option enables you to specify the sum, the mean, or
the frequency for the response variable.