Example 8: Creating a Simple Web Page with the ODS HTML Statement
| Features: |
ODS HTML statement options: BODY=
|
| Sample library member: | GONCSWB1 |
This example illustrates
the simplest way to use the ODS HTML statement to create an HTML file
and a PNG file that you can display in a Web browser. This example
also illustrates
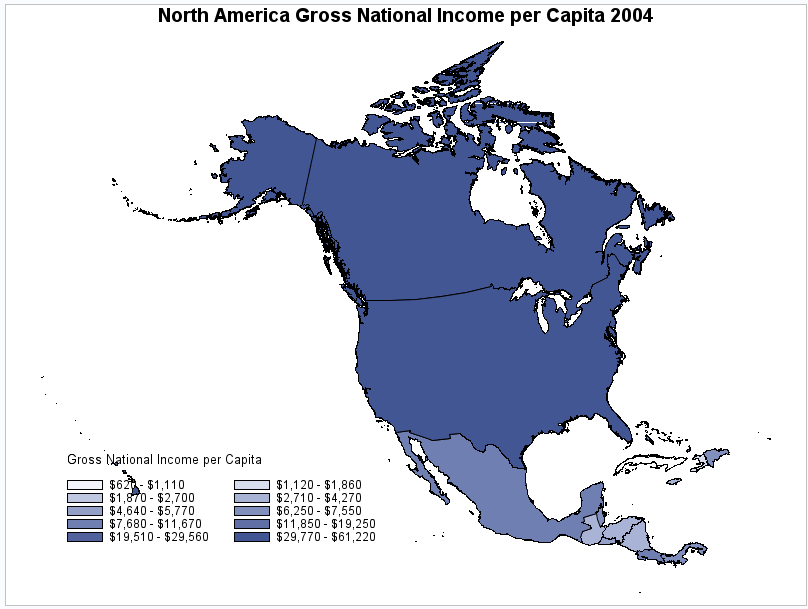
This example generates one body file that displays
one piece of SAS/GRAPH output
a map of average per capita income.
Program
goptions reset=all border;
ods html body="na_body.html";
title1 "North America Gross National Income per Capita 2004";
legend across=2
       origin=(8,5)
       mode=share
       label=(position=top
             justify=left
             "Gross National Income per Capita")
;
proc gmap map=maps.namerica data=sashelp.demographics;
      id cont id;
          format gni dollar10.0;
      choro gni / levels=10 legend=legend1;
run;
quit;
Program Description
Define title for the map. By
default, any defined title is included in the graphics output (PNG
file).
Define legend characteristics. The
ACROSS= option defines the number of columns in the legend. The ORIGIN=
option specifies on the procedure output area the position of the
lower left corner of the legend box. The MODE=SHARE option displays
the legend in the procedure output area along with the map. The LABEL=
option specifies a legend label and left-justifies it above the legend
values.
legend across=2
       origin=(8,5)
       mode=share
       label=(position=top
             justify=left
             "Gross National Income per Capita")
;