Example: Generating Metacode Output with the JAVAMETA Driver
The following example
uses DEVICE=JAVAMETA to generate metcodes to be displayed by the Metaview
applet. It uses ODS to create an HTML file, and GOPTIONS DEVICE=JAVAMETA
with two instances of PROC GCHART to create graphical output in the
form of metacodes. Because both instances of PROC GCHART contain a
BY statement, the HTML file created by ODS contains multiple invocations
of the applet—one invocation for each value of the BY statement
for each procedure (eight invocations in all). The metacodes produced
by PROC GCHART are passed to the applet as a parameter.
When you use DEVICE=JAVAMETA
with ODS, only one graph can be passed to an instance of the Metaview
applet at a time. ODS generates a separate invocation of the Metaview
applet for each SAS/GRAPH procedure that it runs. And, if a procedure
includes BY GROUP processing, then it generates another separate invocation
of the Metaview applet for each BY-group chart. In sum, Metaview applet
presentations generated by ODS never contain a slider page control
or drop-down list graph control to allow a user to select which graph
is to be displayed. Although an HTML page generated by ODS can contain
multiple instances of the Metaview applet, each instance can display
one picture only, and a user must scroll the HTML page to see all
the pictures.
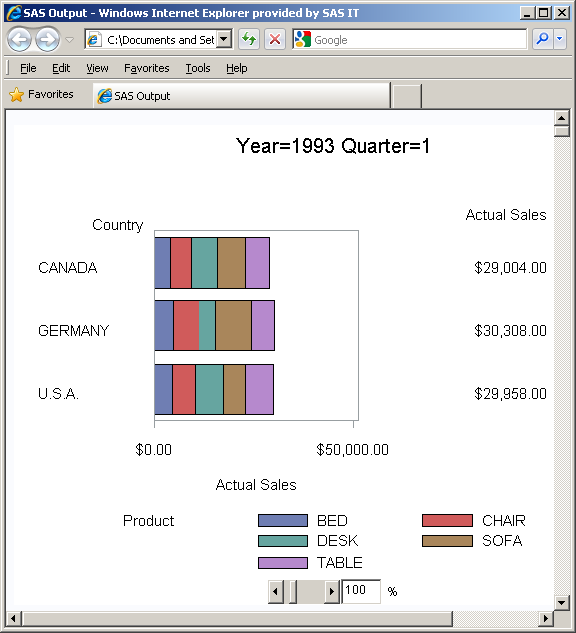
Each GCHART procedure
in this example includes a BY statement to display the results of
each of the four quarters of the year. Consequently, ODS generates
eight separate invocations of the Metaview applet, only the first
of which is shown here. A user would have to scroll the page in the
browser to see all four quarters displayed.
Notice the zoom control
at the bottom of the image. Because the image is displayed by the
Metaview, the run-time option is available to the user to control
the magnification of the chart. If you want to place multiple graphs
in a single metaview applet so that you can use the slider page control
or the play/pause buttons, you must script out your own HTML with
the PUT statement rather than using ODS.