Chart Descriptions for Web Presentations

What Is a Chart Description?

A chart description is the text that describes the entire chart. Default chart descriptions are generated when you use the HTML output destination, in combination with certain device driver entries. A description of your graphics output is created and stored in the HTML IMG tag ALT= attribute in your output file. You can suppress any chart description by specifying the NOALTDESC graphics option. You can display the chart description again by using the ALTDESC graphics option.
Chart descriptions are one way to meet Section 508 standards that require text equivalents for graphics elements. See ACCESSIBLE for an alternate technique.
To supply your own text that describes the chart, use the DESCRIPTION= option with your procedure statement. The maximum length for a custom chart description is 256 characters. See individual procedure statements for DESCRIPTION= option details.

Example: Adding Custom Chart Descriptions

The following code generates a plot chart with a custom chart description. The custom chart description is created using the DESCRIPTION= option. The default device for the HTML destination is PNG, so the output of the following code is an HTML file that references a PNG image file.
goptions reset=all border cback="#FFFFFF";
axis1 label=("Population Est.") minor=(n=2);
symbol v=dot;
proc gplot data=sashelp.citiyr;
   format pan comma7.;
   plot pan*date/ vaxis=axis1 autovref
      description="This is the DESCRIPTION= option text.";
run;
quit;
Plot of Two Variables with a Custom Chart Description
Plot of two variables with a custom chart description displayed as a data tip
Note: Some Web browsers do not display the ALT= attribute text as a data tip. Refer to the documentation for your preferred Web browser to determine how the ALT= attribute text is displayed.

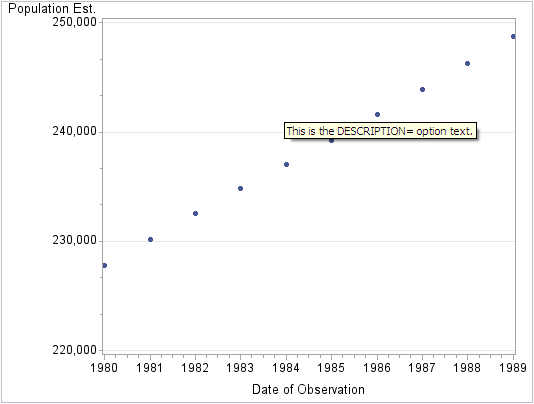
Chart Descriptions in GIF, JPG, PNG, ACTXIMG, and JAVAIMG Presentations

For output generated with the GIF, JPG, PNG, ACTXIMG, and JAVAIMG device drivers, using the ALTDESC graphics option displays the chart description, and is set by default.
The NOALTDESC graphics option suppresses the display of the chart description.
Specifying DESCRIPTION= provides content to the ALT attribute of your HTML file and replaces the default chart description content. The description value is limited to 256 characters. Chart descriptions are not supported in presentations generated by the ActiveX, Java, and JAVAMETA device drivers.
Note: DESCRIPTION=" " can also be used to suppress the chart description.

Chart Descriptions in SVG, SVGT, SVGView, and SVGZ Presentations

For output generated with the SVG, SVGT, SVGView, and SVGZ device drivers, using the ALTDESC graphics option displays the chart description, and is set by default.
The NOALTDESC graphics option suppresses the display of the chart description.
Specifying DESCRIPTION= provides content to the feMerge element of your output file and replaces the default chart description content. The description value is limited to 256 characters.
Note: DESCRIPTION=" " can also be used to suppress the chart description.