Monitoring Resources
A central capability
of SAS Environment Manager is the ability to monitor resources. Monitoring
enables you to track a resource’s availability and overall
health. A variety of metric data is displayed, both in numeric and
graphic format, to enable you to examine detailed information about
the resource’s operation.
To view the monitoring information for
a resource, select a resource from the table on the Resources page.
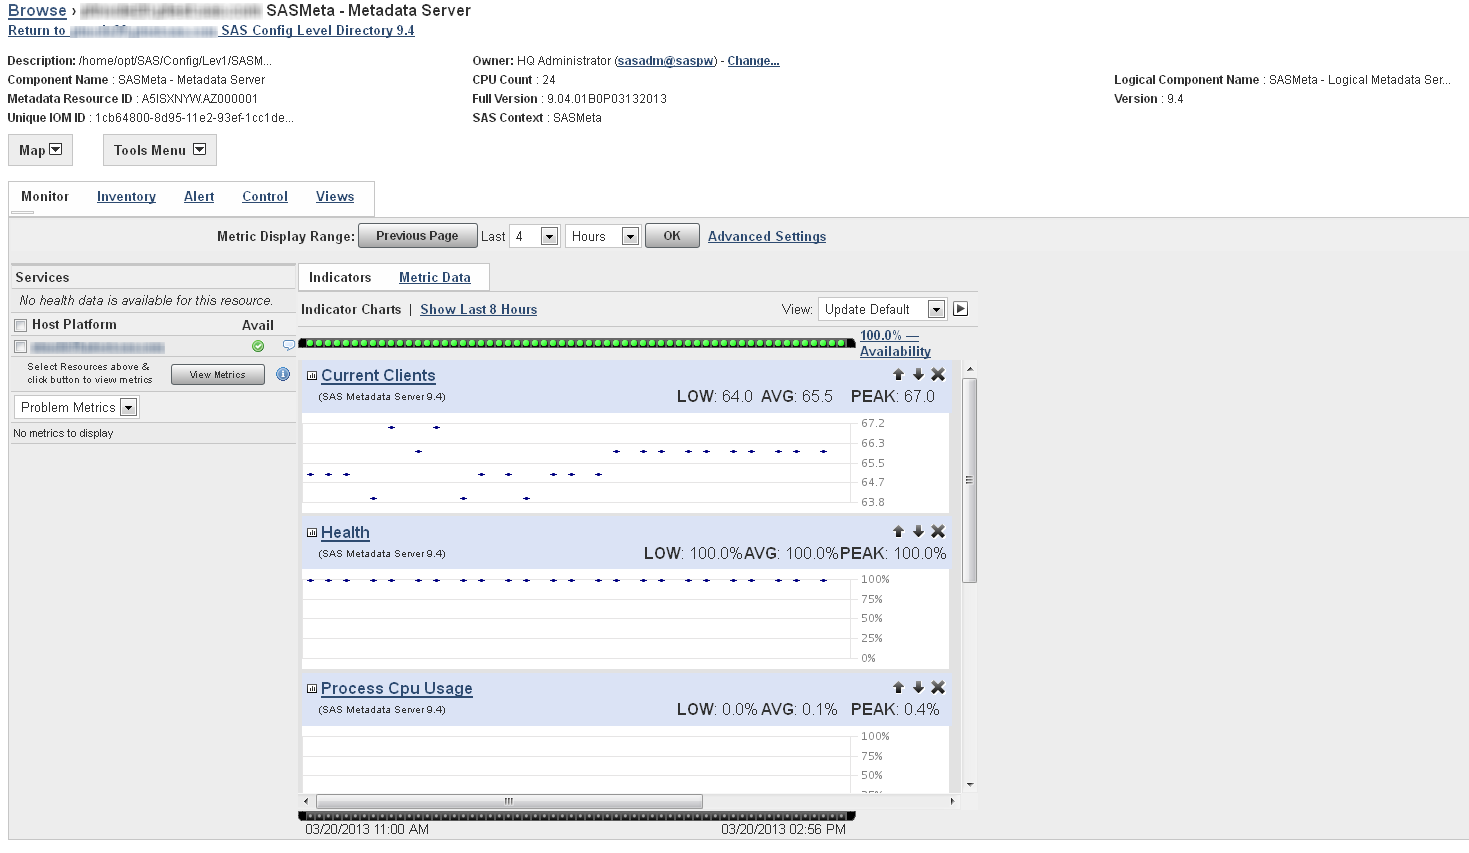
The
fastest way to check the status of the selected resource is to use
the availability bar, which is above the indicator charts. The availability
bar displays a color-coded dot that represents the availability during
a time slice. The length of each time slice depends on the display
range that you select (for example, if you display the past eight
hours of data, each dot corresponds to approximately eight minutes).
The percentage of time that the resource was available is displayed
at the end of the availability bar.
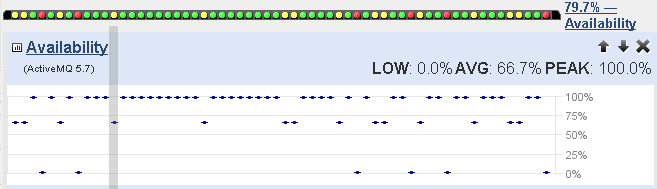
The dots are color-coded
using the following format:
Green
100% availability
Yellow
Partial availability;
between 0% and 100%
Red
0% availability
An availability bar
such as the one in the following figure shows that the resource fluctuated
between being available, partially available, and unavailable over
the most recent time slices.

To help determine the
cause of availability problems, click on the dot for a particular
time slice. The selected time slice is highlighted on the indicator
charts below the availability bar. This function helps you quickly
check the charts for data that might correspond to the availability
problem.
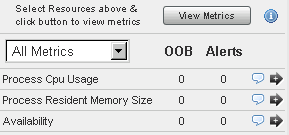
To change the metrics
that are displayed in the metric charts, use the menu on the left
side of the page to select either All Metrics or Problem
Metrics, and then click View Metrics to
display a lit of available metrics. Click the arrow beside a metric
to add the chart to those displayed on the page.
The events bar is displayed
below the indicator charts. It is similar to the availability bar,
with dots representing time slices. The bar displays only a red dot
if an event occurs during a time slice. If no event occurs, the bar
remains black.

Copyright © SAS Institute Inc. All Rights Reserved.
Last updated: February 22, 2018