Metric Chart Examples
Adding a Saved Chart Portlet
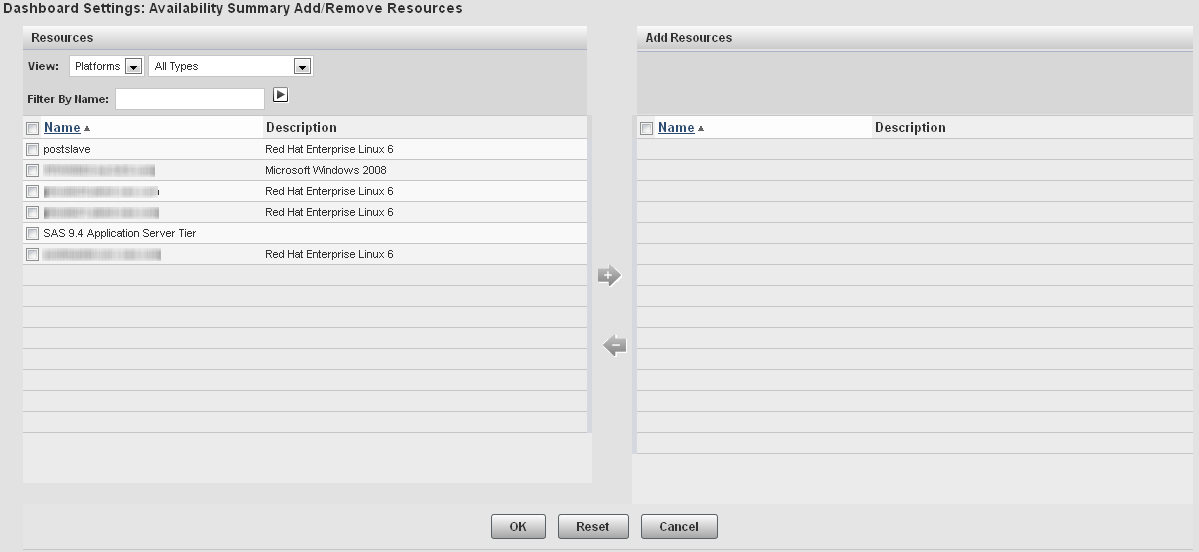
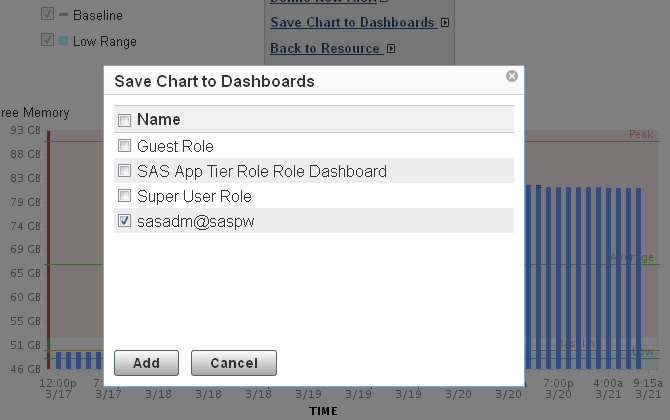
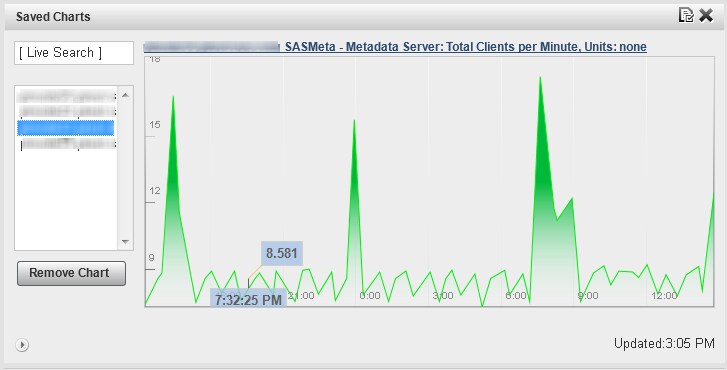
The Saved Chart portlet
displays a rotation of all of the resource metric charts that you
have saved. The process of creating this type of portlet consists
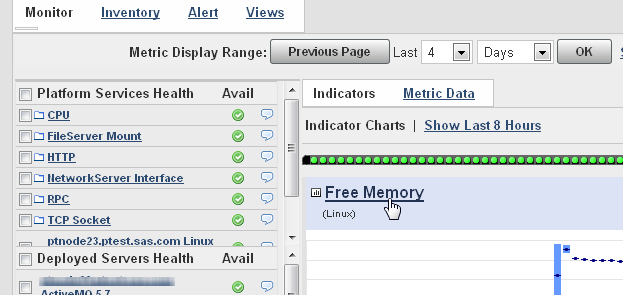
of navigating to the resources that you want to chart, finding the
metric charts that you want to display, and saving them to your dashboard.
When you create the portlet, all of your saved charts automatically
appear. Here are the basic steps for adding a metric viewer portlet
to your Dashboard page.
-
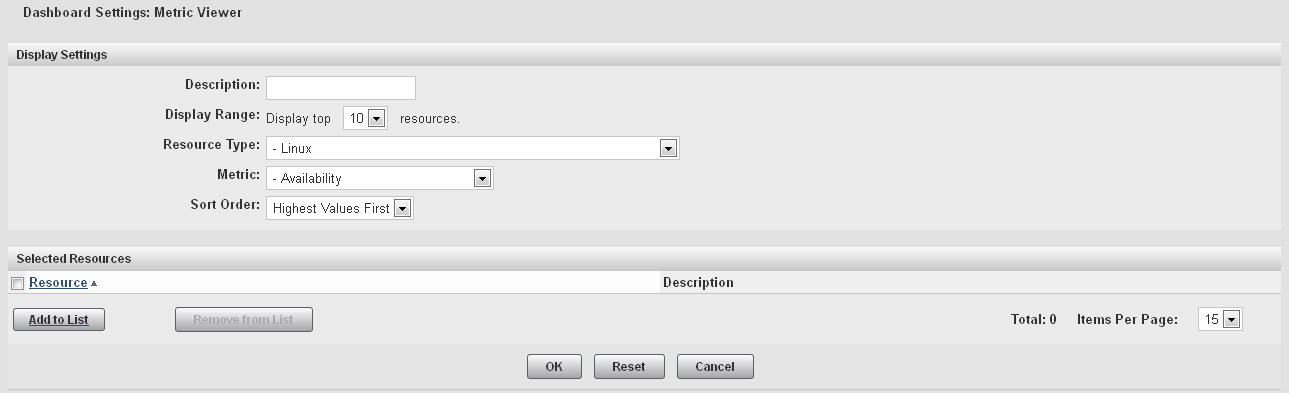
On the Dashboard Settings page, specify a name for the portlet in the Description field. Select the type of resource that you want to monitor in the Resource Type field and the information that you want to display in the Metric field. The values available in the Metric field change depending on what you select in the Resource Type field.


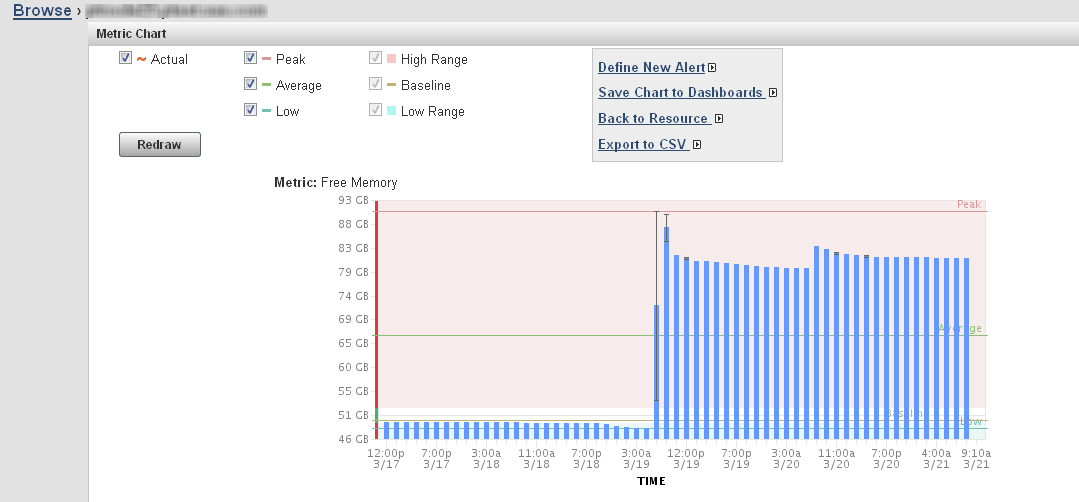
Creating a Free Memory Chart
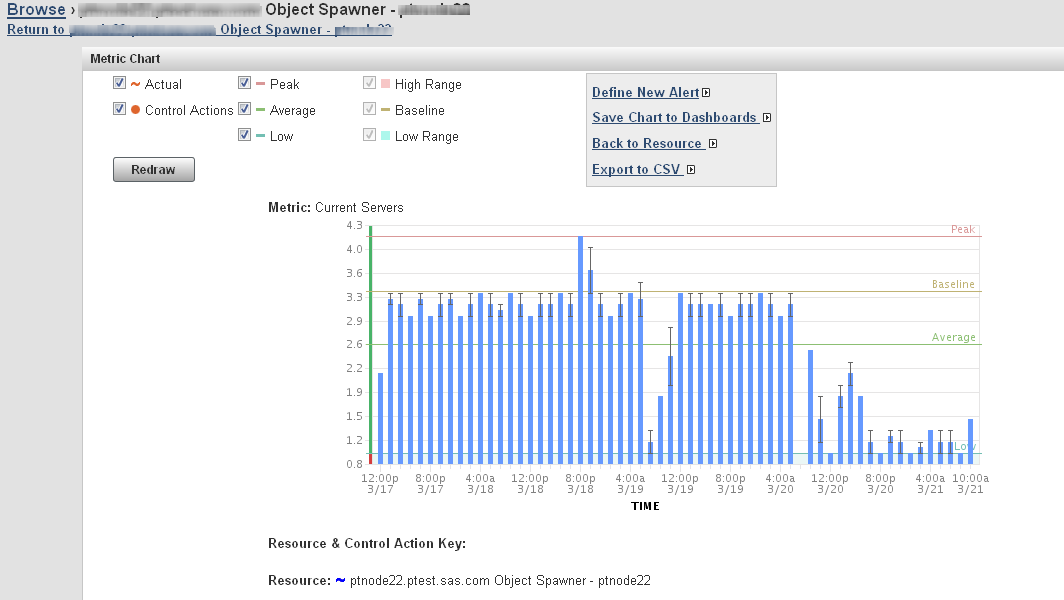
Creating a Number of Spawned Servers Chart
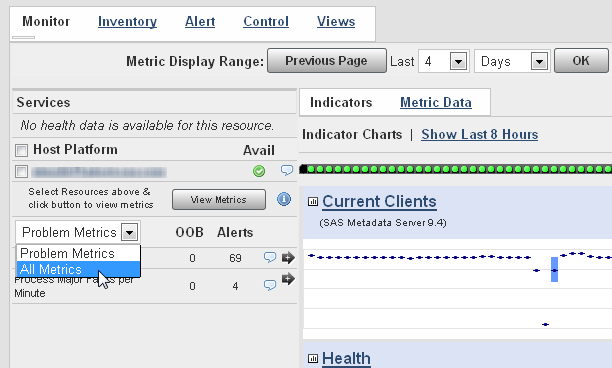
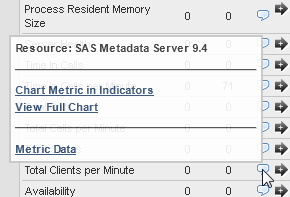
Creating a Metadata Users Chart
Copyright © SAS Institute Inc. All rights reserved.