Getting Started with Time Series Forecasting
The Forecast Data Set
The Forecasting System can save the forecasts to a SAS data set in three different formats. Depending on your needs, you might
find one of these output formats more convenient. The output data set format is controlled by the Format combo box. You can select the following output formats. The simple format is the default.
Simple-
The data set contains time ID variables and the forecast variables, and it contains one observation per time period. Observations for earlier time periods contain actual values copied from the input data set; later observations contain the forecasts.
Interleaved-
The data set contains time ID variables, the variable TYPE, and the forecast variables. There are several observations per time period, with the meaning of each observation identified by the TYPE variable.
Concatenated-
The data set contains the variable SERIES, time ID variables, and the variables ACTUAL, PREDICT, ERROR, UPPER, LOWER, and STD. There is one observation per time period per forecast series. The variable SERIES contains the name of the forecast series, and the data set is sorted by SERIES and DATE.
Simple Format Forecast Data Set
To see the simple format forecast data set that the system created, select the Output button. This opens a VIEWTABLE window to display the data set, as shown in Figure 54.19.
Figure 54.19: Forecast Data Set—Simple Format
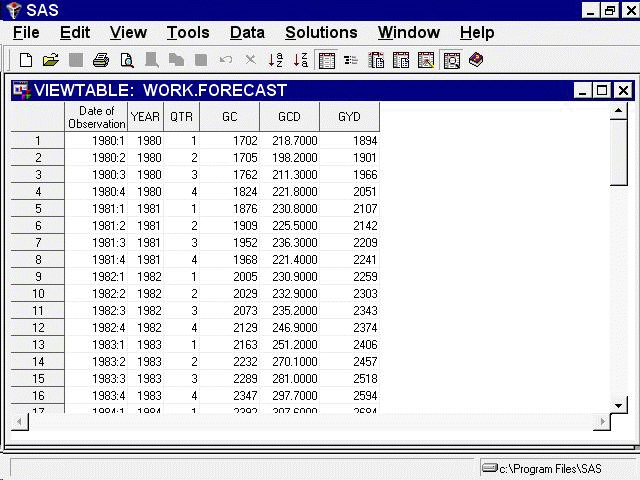
Figure 54.19 shows the default simple format. This form of the forecast data set contains time ID variables and the variables that you forecast. The forecast variables contain actual values or predicted values, depending on whether the date of the observation is within the range of data supplied in the input data set.
Select File and Close to close the Viewtable window.
Interleaved Format Forecast Data Set
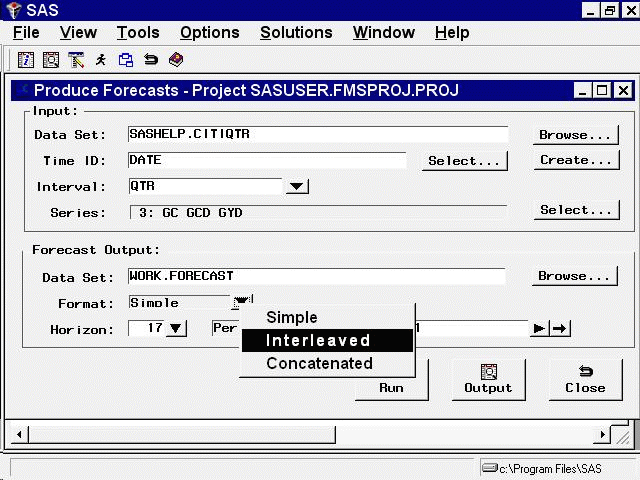
From the Produce Forecasts window, use the list to select the Interleaved format, as shown in Figure 54.20.
Figure 54.20: Forecast Data Set Options
Now select the Run button again. The system presents a warning notice reminding you that the data set WORK.FORECAST already
exists and asking if you want to replace it. Select Replace.
The forecasts are stored in the data set WORK.FORECAST again, this time in the Interleaved format. Dismiss the notice that the forecast was stored.
Now select the Output button again. This opens a Viewtable window to display the data set, as shown in Figure 54.21.
Figure 54.21: Forecast Data Set—Interleaved Format
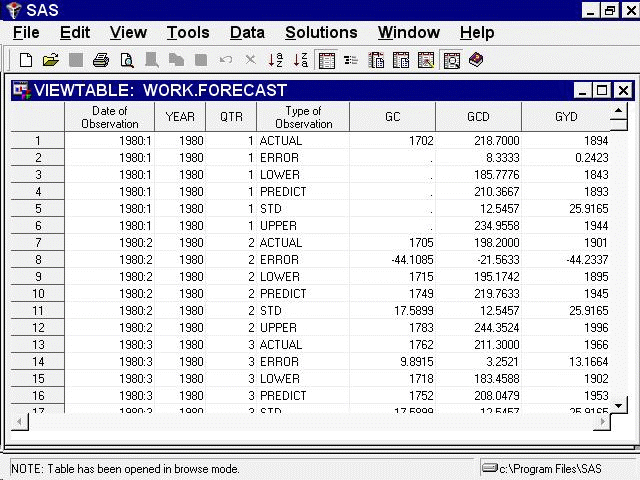
In the interleaved format, there are several output observations for each input observation, identified by the TYPE variable. The values of the forecast variables for observations with different TYPE values are as follows.
ACTUAL-
actual values copied from the input data set
ERROR-
the difference between the actual and predicted values
LOWER-
the lower confidence limits
PREDICT-
the predicted values from the forecasting model These are within-sample, one-step-ahead predictions for observations within the historical period, or multistep predictions for observations within the forecast period
STD-
the estimated standard deviations of the prediction errors
UPPER-
the upper confidence limits
Select File and Close to close the VIEWTABLE window.
Concatenated Format Forecast Data Set
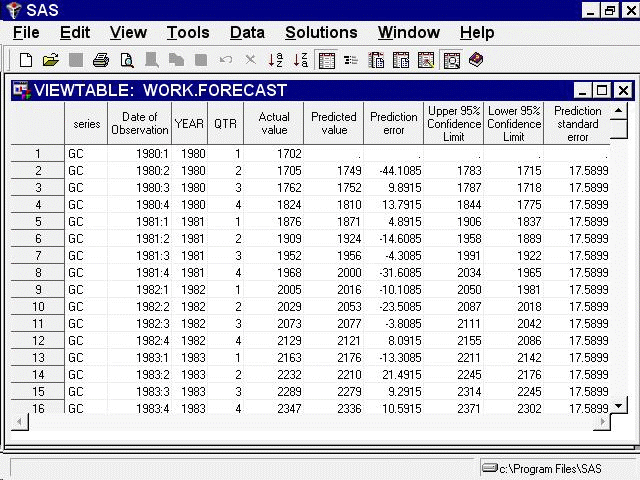
Use the list to select the Concatenated format. Create the forecast data set again, and then select the Output button.
The Viewtable window showing the concatenated format of the forecast data set appears, as shown in Figure 54.22.
Figure 54.22: Forecast Data Set—Concatenated Format
This completes the example of how to use the Produce Forecasts window. Select File and Close to close the Viewtable window. Select the Close button to return to the Time Series Forecasting window.