Analyses
Performing a Benefit-Cost Ratio Analysis
Suppose a municipality has excess funds to invest. It is choosing between the same investments described in the previous example. Government agencies often compute benefit-cost ratios to decide which investment to pursue. Which is best in this case?
Open the portfolio SASHELP.INVSAMP.NVST and compare the investments.
To compute the benefit-cost ratios, follow these steps:
-
Select all five investments.
-
Select Analyze
 Benefit-Cost Ratio.
-
Enter 01JAN1996 for the Date.
-
Enter 9 for Constant MARR.
-
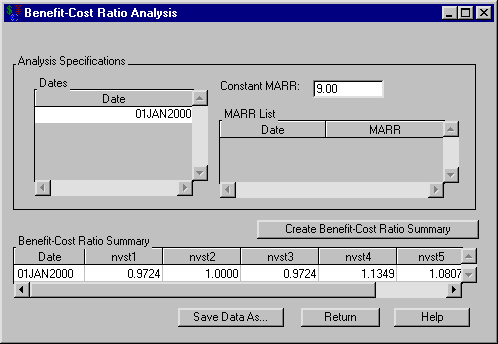
Click Create Benefit-Cost Ratio Summary to fill the Benefit-Cost Ratio Summary area.
The results displayed in Figure 66.5 indicate that investments 2, 4, and 5 have ratios greater than 1. Therefore, each is profitable with a MARR of 9%.
Figure 66.5: Performing a Benefit-Cost Ratio Analysis