Getting Started with Time Series Forecasting
Select the last icon at the bottom of the vertical toolbar to the right of the graph. This switches the Viewer to display the forecast data set as a table, as shown in Figure 46.48.
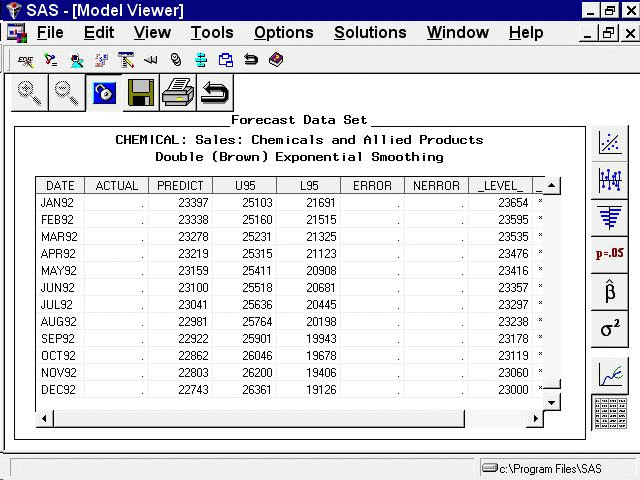
To view the full data set, use the vertical and horizontal scroll bars on the data table or enlarge the window.