Investments
The following items are displayed:
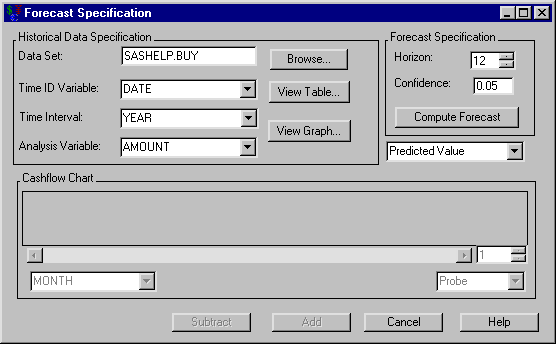
Historical Data Specification
-
Data Set holds the name of the SAS data set to forecast.
-
Browse opens the standard SAS Open dialog box to help select a SAS data set to forecast.
-
Time ID Variable holds the time ID variable to forecast over.
-
Time Interval fixes the time interval for the Time ID Variable.
-
Analysis Variable holds the data variable upon which to forecast.
-
View Table opens a table that displays the contents of the specified SAS data set.
-
View Graph opens the Time Series Viewer that graphically displays the contents of the specified SAS data set.
Forecast Specification
-
Horizon holds the number of periods into the future you want to forecast.
-
Confidence holds the confidence limit for applicable forecasts.
-
Compute Forecast fills the Cashflow Chart with the forecast.
The box below Forecast Specification holds the type of forecast you want to generate:
-
Predicted Value
-
Lower Confidence Limit
-
Upper Confidence Limit
The Cashflow Chart fills when you click Compute Forecast. The box to the right of the scroll bar controls the number of entries with which to fill the graph. If the number in this box is less than the total number of entries, you can use the scroll bar to view different segments of the cashflow. The left box below the scroll bar holds the frequency.
Subtract becomes available when the collection of entries is adequately specified. Clicking Subtract then returns you to the Generic Cashflow dialog box subtracting the forecast from the current cashflow.
Add becomes available when the collection of entries is adequately specified. Clicking Add then returns you to the Generic Cashflow adding the forecast to the current cashflow.
Cancel returns to Generic Cashflow dialog box without changing the cashflow.