Before you can produce forecasts, you must fit forecasting models to the time series. Select the Fit Models Automatically button. This opens the Automatic Model Fitting window, as shown in Figure 45.9.
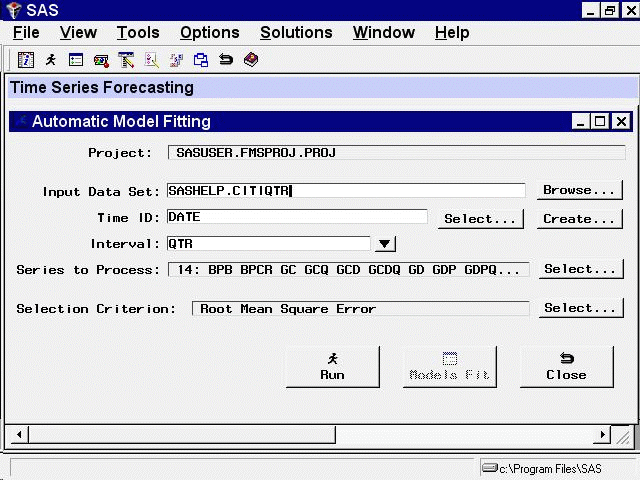
The first part of the Automatic Model Fitting window confirms the project filename and the input data set name.
The Series to Process field shows the number and lists the names of the variables in the input data set to which the Automatic Model Fitting process will be applied. By default, all numeric variables (except the time ID variable) are processed. However, you can specify that models be generated for only a select subset of these variables.
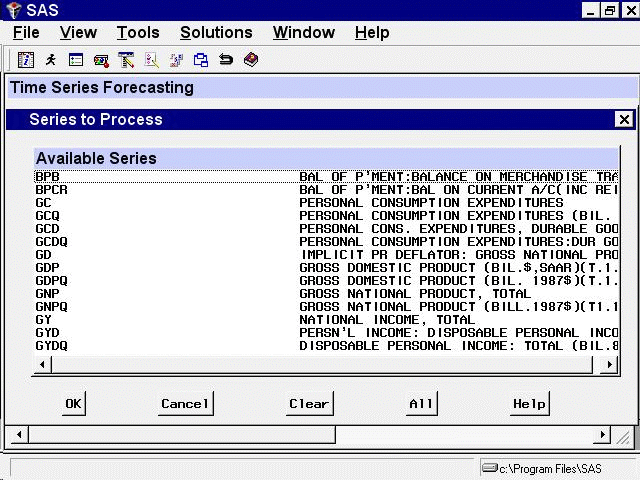
Click the Select button to the right of the Series to Process field. This opens the Series to Process window, as shown in Figure 45.10.
Use the mouse and the CTRL key to select the personal consumption expenditures series (GC), the personal consumption expenditures for durable goods series (GCD), and the disposable personal income series (GYD), as shown in Figure 45.11. (Remember to hold down the CTRL key as you make the selections; otherwise, selecting a second series will deselect the first.)
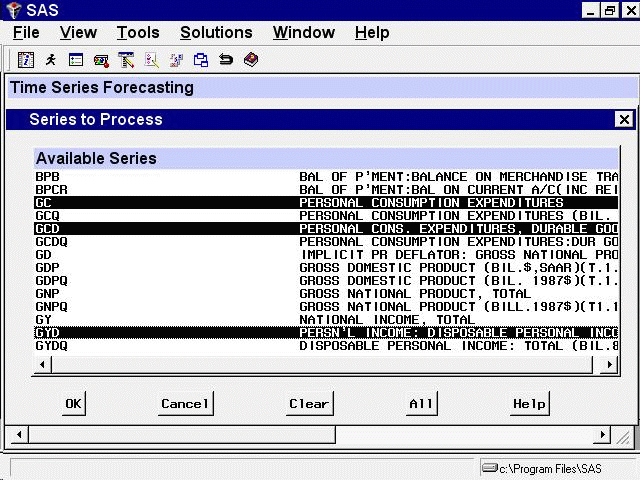
Now select the OK button. This returns you to the Automatic Model Fitting window. The Series to Process field now shows the selected variables.
The Selection Criterion field shows the goodness-of-fit measure that the Forecasting System will use to select the best fitting model for each series. By default, the selection criterion is the root mean squared error. To illustrate how you can control the selection criterion, this example uses the mean absolute percent error to select the best fitting models.
Click the Select button to the right of the Selection Criterion field. This opens a list of statistics of fit, as shown in Figure 45.12.
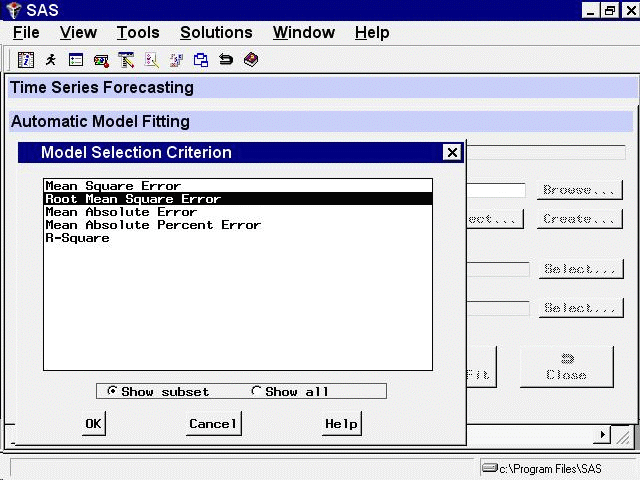
Select Mean Absolute Percent Error and then select the OK button. The Automatic Model Fitting window now appears as shown in Figure 45.13.
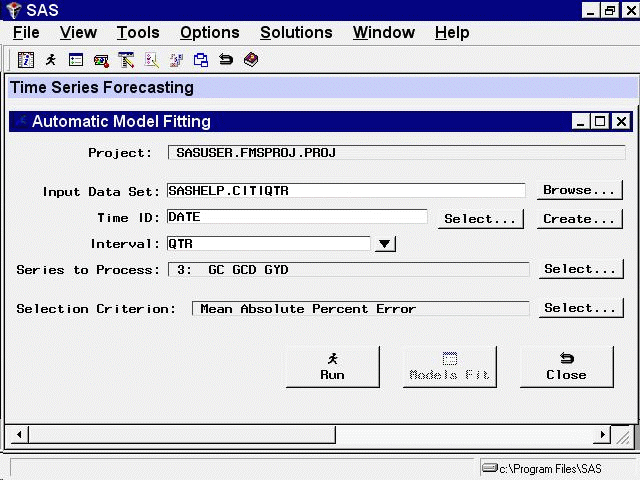
Now that all the options are set appropriately, select the Run button.
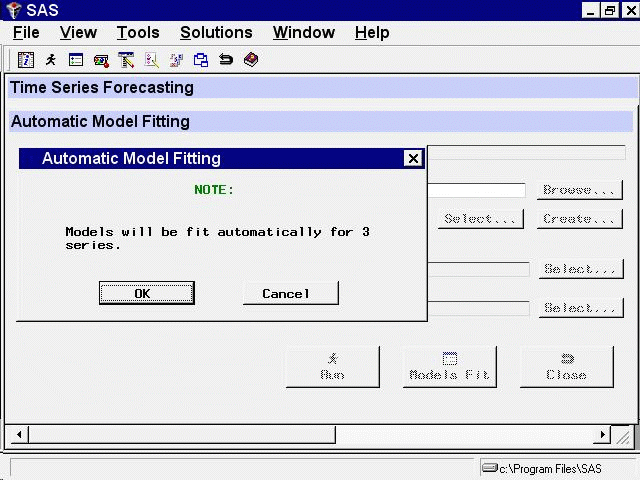
The Forecasting System now displays a notice, shown in Figure 45.14, confirming that models will be fit for three series using the automatic forecasting model search feature. This prompt is displayed because it is possible to fit models for a large number of series at once, which might take a lot of time. So the system gives you a chance to cancel if you accidentally ask to fit models for more series than you intended. Select the OK button.
The system now fits several forecasting models to each of the three series you selected. While the models are being fit, the Forecasting System displays notices indicating what it is doing so that you can observe its progress, as shown in Figure 45.15.
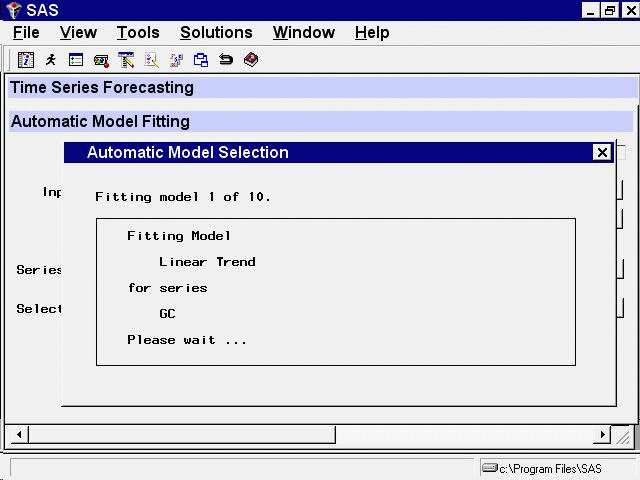
For each series, the system saves the model that produces the smallest mean absolute percent error. You can have the system
save all the models fit by selecting Automatic Fit from the Options menu.
After the Automatic Model Fitting process has completed, the results are displayed in the Automatic Model Fitting Results window, as shown in Figure 45.16.
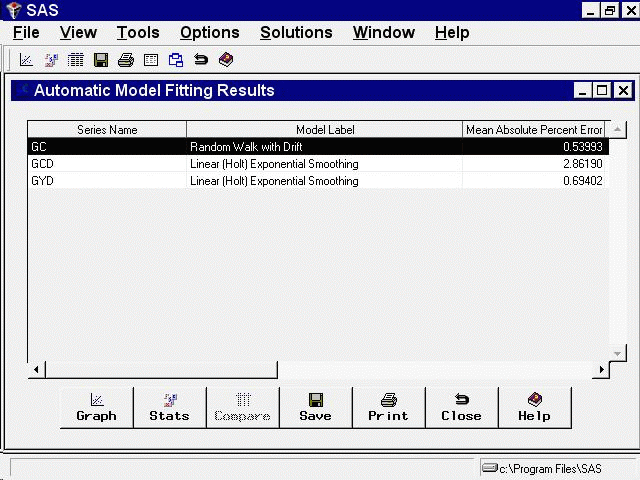
This resizable window shows the list of series names and descriptive labels for the forecasting models chosen for them, as well as the values of the model selection criterion and other statistics of fit. Select the Close button.
This returns you to the Automatic Model Fitting window. You can now fit models for other series in this data set or change to a different data set and fit models for series in the new data set.
Select the Close button to return to the Time Series Forecasting window.