Now add an intervention to account for the drop in the series in late 1985. You can locate the date of this event by selecting points in the Time Series Viewer plot or by scrolling through the data values table in the Interventions Specification window. Use the latter method so that you can see how this works.
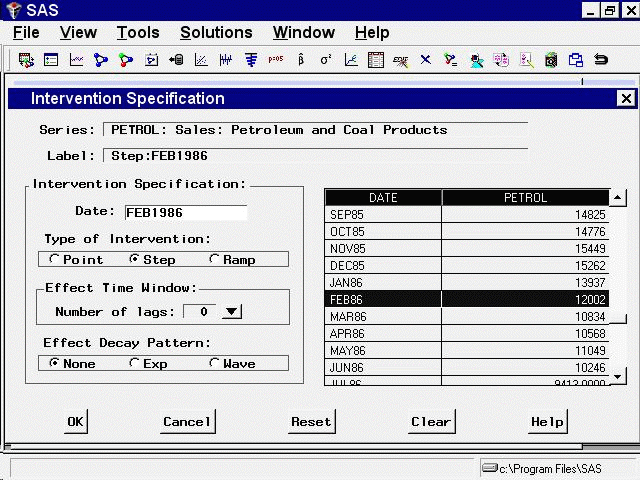
Scrolling through the table, you see that the drop was from 15262 in December 1985, to 13937 in January 1986, to 12002 in February, to 10834 in March. Since the drop took place over several periods, you could use another ramp type intervention. However, this example represents the drop as a sudden event by using a step intervention and uses February 1986 as the approximate time of the drop.
Select the table row for February 1986 to set the Date field. Select Step as the intervention type. The window should now appear as shown in Figure 49.19.
Select the OK button to add this intervention to the list for the series.
Since the trend reverses again after the drop, add a ramp intervention for the same date as the step intervention. Select
Add from the Interventions for Series window. Enter FEB86 in the Date field, select Ramp, and then select the OK button.