There are several ways to get to the Time Series Forecasting System. If you prefer to use commands, invoke the system by entering
forecast on the command line. You can optionally specify additional information on the command line; see Chapter 50: Command Reference, for details.
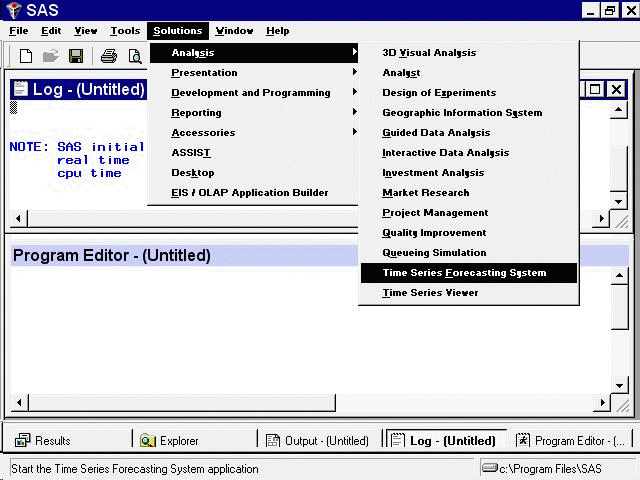
If you are using the SAS windowing environment with pull-down menus, select the Solutions menu from the menu bar, select the
Analysis item, and then select Time Series Forecasting System, as shown in Figure 45.1.
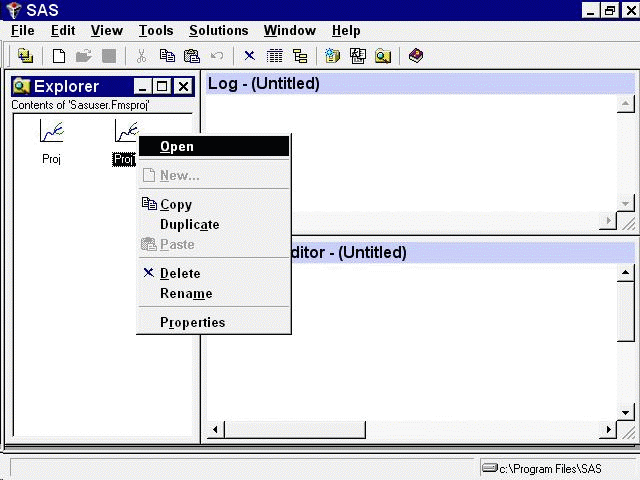
You can invoke the Forecasting System from the SAS Explorer window by opening an existing forecasting project. By default these projects are stored in the FMSPROJ catalog in the SASUSER library. Select SASUSER in the Explorer to display its contents. Then select FMSPROJ. This catalog is created the first time you use the Forecasting System. If you have saved projects, they appear in the Explorer with the forecasting graph icon, as shown in Figure 45.2. Double-click one of the projects, or select it with the right mouse button and then select Open from the pop-up menu, as shown in the figure. This opens the Forecasting System and opens the selected project.
To invoke the Forecasting System in the SAS desktop environment, select the Solutions menu from the menu bar, select Desktop, and then open the Analysis folder. You can run the Time Series Forecasting System or the Time Series Viewer directly, or
you can drag and drop. Figure 45.3 illustrates dragging a data set (known as a table in the Desktop environment) and dropping it on the Forecasting icon. In
this example, the tables reside in a user-defined folder called Time Series Data.

If you are using SAS/ASSIST software, select the Planning button and then select Forecasting from the pop-up menu.
Any of these methods takes you to the Time Series Forecasting window, as shown in Figure 45.4.
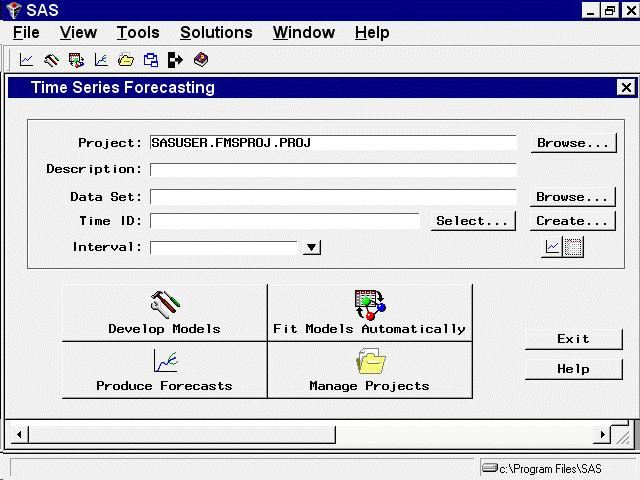
At the top of the window is a data selection area for specifying a project file and the input data set containing historical data (the known past values) for the time series variables that you want to forecast. This area also contains buttons for opening viewers to explore your input data either graphically, one series at a time, or as a table, one data set at a time.
The Project and Description fields are used to specify a project file for saving and restoring forecasting models created by the system. Using project files is discussed later, and these fields are ignored for now.
The lower part of the window contains six buttons:
Develop Models-
opens the Develop Models window, which you use to develop and fit forecasting models interactively for individual time series.
Fit Models Automatically-
opens the Automatic Model Fitting window, which you use to search automatically for the best forecasting model for multiple series in the input data set.
Produce Forecasts-
opens the Produce Forecasts window, which you use to compute forecasts for all the variables in the input data set for which forecasting models have been fit.
Manage Projects-
opens the Manage Forecasting Project window, which lists the time series for which you have fit forecasting models. You can drill down on a series to see the models that have been fit. You can delete series or models from the project, re-evaluate or refit models, and explore models and forecasts graphically or in tabular form.
Exit-
exits the Forecasting System.
Help-
displays information about the Forecasting System.