| Window Reference |
Manage Forecasting Project Window
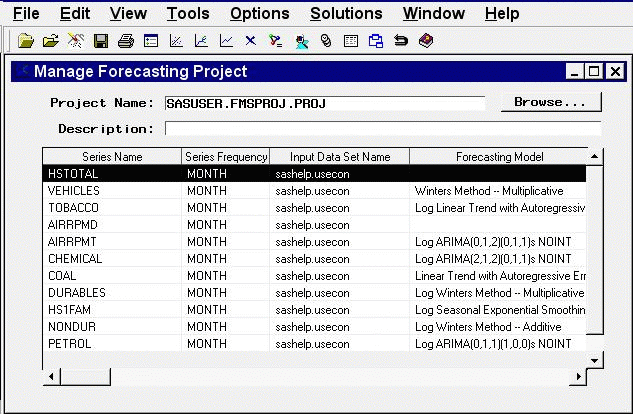
Use this resizable window to work with collections of series, models, and options called projects. The window contains a project name, a description field, and a table of information about all the series for which you have fit forecasting models. Access it by using the Manage Projects button on the Time Series Forecasting window.
Controls and Fields
- Project Name
is the name of the SAS catalog entry in which forecasting models and other results will be stored and from which previously stored results are loaded into the forecasting system. You can specify the project by typing a SAS catalog entry name in this field or by selecting the Browse button to the right of this field. If you specify the name of an existing catalog entry, the information in the project file is loaded. If you specify a one-level name, it is assumed to be the name of a project in the "fmsproj" catalog in the "sasuser" library. For example, typing samproj is equivalent to typing sasuser.fmsproj.samproj.- project Browse button
opens the Forecasting Project File Selection window to enable you to select and load the project from a list of previously stored project files.- Description
is a descriptive label for the forecasting project. The description you type in this field will be stored with the catalog entry shown in the Project field if you save the project.
Series List Table
The table of series for which forecasting models have been fit contains the following columns.
- Series Name
is the name of the time series variable represented in the given row of the table.- Series Frequency
is the time interval (data frequency) for the time series.- Input Data Set Name
is the input data set that provided the data for the series.- Forecasting Model
is the descriptive label for the forecasting model selected for the series.- Statistic Name
is the statistic of fit for the forecasting model selected for the series.- Number of Models
is the total number of forecasting models fit to the series. If there is more than one model for a series, use the Model List window to see a list of models.- Series Label
is the variable label for the series.- Time ID Variable Name
is the time ID variable for the input data set for the series.- Series Data Range
is the time range of the nonmissing values of the series.- Model Fit Range
is the period of fit used for the series.- Model Evaluation Range
is the evaluation period used for the series.- Forecast Range
is the forecast period set for the series.
Menu Bar
- File
- New
opens a dialog which lets you create a new project, assign it a name and description, and make it the active project.- Open
opens a dialog that lets you select and load a previously saved project.- Close
closes the Manage Forecasting Project window and returns to the main window.- Save
saves the current state of the system (including all the models fit to a series) to the current project catalog entry.- Save As
saves the current state of the system with a prompt for the name of the catalog entry in which to store the information.- Save to Data Set
saves the current project file information in a SAS data set. The contents of the data set are the same as the information displayed in the series list table.- Delete
deletes the current project file.- Import Data
is available if you license SAS/Access software. It opens an Import Wizard, which you can use to import your data from an external spreadsheet or data base to a SAS data set for use in the Time Series Forecasting System.- Export Data
is available if you license SAS/Access software. It opens an Export Wizard, which you can use to export a SAS data set, such as a forecast data set created with the Time Series Forecasting System, to an external spreadsheet or data base.
prints the current project file information.- Print Setup
opens the Print Setup window, which allows you to access your operating system print setup.
- Edit
- Delete Series
deletes all models for the selected (highlighted) row of the table and removes the series from the project.- Clear
resets the system, deleting all series and models from the project.- Reset
restores the Manage Forecasting Project window to its initial state.
- View
- Data Set
opens a Viewtable window to display the input data set for the selected (highlighted) series.- Series
opens the Time Series Viewer window to display plots of the selected (highlighted) series.- Model
opens the Model Viewer window to show the current forecasting model for the selected series.- Forecast
opens the Model Viewer to display plots of the forecasts produced by the forecasting model for the selected (highlighted) series.
- Tools
- Diagnose Series
opens the Series Diagnostics window to perform the automatic series diagnostic process to determine the kinds of forecasting models appropriate for the selected (highlighted) series.- List Models
opens the Model List window for the selected (highlighted) series, which displays a list of all the models that you fit for the series. This action is the same as double-clicking the mouse on the table row.- Generate Data
opens the Time Series Simulation window. This window enables you to simulate ARIMA time series processes and is useful for educational exercises or testing the system.- Refit Models
- All Series
refits all the models for all the series in the project by using data within the current fit range.- Selected Series
refits all the models for the currently highlighted series by using data within the current fit range.
- Reevaluate Models
- All Series
reevaluates all the models for all the series in the project by using data within the current evaluation fit range.- Selected Series
reevaluates all the models for the currently highlighted series by using data within the current evaluation range.
- Options
- Time Ranges
opens the Time Ranges Specification window to enable you to change the fit and evaluation time ranges and the forecast horizon.- Default Time Ranges
opens the Default Time Ranges window to enable you to control how the system sets the time ranges for series when you do not explicitly set time ranges with the Time Ranges Specification window. Settings made by using this window do not affect series you are already working with; they take effect when you select a new series.- Model Selection List
opens the Model Selection List editor window. Use this to edit the set of forecasting models considered by the automatic model selection process and displayed by the Models to Fit window.- Statistics of Fit
opens the Statistics of Fit Selection window, which controls which of the available statistics will be displayed.- Forecast Options
opens the Forecast Options window, which enables you to control the widths of forecast confidence limits and control the kind of predicted values computed for models that include series transformations.- Column Labels
enables you to set long or short column labels. Long labels are used by default.- Include Interventions
controls whether intervention effects defined for the current series are automatically added as predictors to the models considered by the automatic selection process and displayed by the Model Selection List editor window. When the Include Interventions option is selected, the series interventions are also automatically added to the predictors list when you specify a model in the ARIMA and Custom Models Specification windows.- Print Audit Trail
prints to the SAS log information about the models fit by the system. A check mark or filled check box next to this item indicates that the audit option is turned on.- Show Source Statements
controls whether SAS statements submitted by the forecasting system are printed in the SAS log. When the Show Source Statements option is selected, the system sets the SAS system option SOURCE before submitting SAS statements; otherwise, the system uses the NOSOURCE option. Note that only some of the functions performed by the forecasting system are accomplished by submitting SAS statements. A check mark or filled check box next to this item indicates that the option is turned on.
Left Mouse Button Actions
If you select a series in the table by positioning the cursor over the table row and clicking with the left mouse button once, that row of the table is highlighted. Menu bar actions such as Delete Series will apply to the highlighted row of the table.
If you select a series in the table by positioning the cursor over the table row and double-clicking with the left mouse button, the system opens the Model List window for that series, which displays a list of all the models that you fit for the series. This is the same as the List Models action under Tools in the menu bar.
Right Mouse Button Actions
Clicking the right mouse button invokes a pop-up menu of actions applicable to the highlighted series. The actions in this menu are as follows.
- Delete Series
deletes the highlighted series and its models from the project. This is the same as Delete Series in the Edit menu.- Refit All Models
refits all models attached to the highlighted series by using data within the current fit range. This is the same as the Selected Series item under Refit Models in the Tools menu.- Reevaluate All Models
reevaluates all models attached to the highlighted series by using data within the current evaluation range. This is the same as the Selected Series item under Reevaluate Models in the Tools menu.- List Models
invokes the Model List window. This is the same as List Models under the Tools menu.- View Series
opens the Time Series Viewer window to display plots of the highlighted series. This is the same as the Series item under the View menu.- View Forecasting Model
invokes the Model Viewer window to display the forecasting model for the highlighted series. This is the same as the Model item under the View menu.- View Forecast
opens the Model Viewer window to display the forecasts for the highlighted series. This is the same as the Forecast item under the View menu.- Refresh
updates information shown in the Manage Forecasting Project window.
Copyright © SAS Institute, Inc. All Rights Reserved.