| The X11 Procedure |
| Computational Details for Sliding Spans Analysis |
Length and Number of Spans
The algorithm for determining the length and number of spans for a given series was developed at the U.S. Bureau of the Census, Statistical Research Division. A summary of this algorithm is as follows.
First, an initial length based on the MACURVE month=option specification is determined, and then the maximum number of spans possible using this length is determined. If this maximum number exceeds four, set the number of spans to four. If this maximum number is one or zero, there are not enough observations to perform the sliding spans analysis. In this case a note is written to the log and the sliding spans analysis is skipped for this variable.
If the maximum number of spans is two or three, the actual number of spans used is set equal to this maximum. Finally, the length is adjusted so that the spans begin in January (or the first quarter) of the beginning year of the span.
The remainder of this section gives the computation formulas for the maximum percentage difference (MPD) calculations along with the threshold regions.
Seasonal Factors (Table D10)
For the additive model, the MPD is defined as
 |
For the multiplicative model, the MPD is
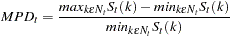 |
A series for which less than 15% of the MPD values of D10 exceed 3.0% is stable; between 15% and 25% is marginally stable; and greater than 25% is unstable. Span reports S 2.A through S 2.C give the various breakdowns for the number of times the MPD exceeded these levels.
Trading Day Factor (Table C18)
For the additive model, the MPD is defined as
 |
For the multiplicative model, the MPD is
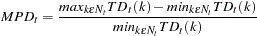 |
The U.S. Census Bureau currently gives no recommendation concerning MPD thresholds for the trading-day factors. Span reports S 3.A through S 3.C give the various breakdowns for MPD thresholds. When TDREGR=NONE is specified, no trading-day computations are done, and this table is skipped.
Seasonally Adjusted Data (Table D11)
For the additive model, the MPD is defined as
 |
For the multiplicative model, the MPD is
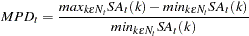 |
A series for which less than 15% of the MPD values of D11 exceed 3.0% is stable; between 15% and 25% is marginally stable; and greater than 25% is unstable. Span reports S 4.A through S 4.C give the various breakdowns for the number of times the MPD exceeded these levels.
Month-to-Month Changes in the Seasonally Adjusted Data
Some additional notation is needed for the month-to-month and year-to-year differences. Define  as
as
 |
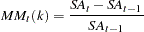
For the additive model, the month-to-month change for span  is defined as
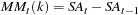 |
while for the multiplicative model
 |
Since this quantity is already in percentage form, the MPD for both the additive and multiplicative model is defined as
 |
The current recommendation of the U.S. Census Bureau is that if 35% or more of the MPD values of the month-to-month differences of D11 exceed 3.0%, then the series is usually not stable; 40% exceeding this level clearly marks an unstable series. Span reports S 5.A.1 through S 5.C give the various breakdowns for the number of times the MPD exceeds these levels.
Year-to-Year Changes in the Seasonally Adjusted Data
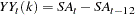
First define  as
as
 |
(Appropriate changes in notation for a quarterly series are obvious.)
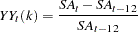
For the additive model, the month-to-month change for span is defined as
 |
while for the multiplicative model
 |
Since this quantity is already in percentage form, the MPD for both the additive and multiplicative model is defined as
 |
The current recommendation of the U.S. Census Bureau is that if 10% or more of the MPD values of the month-to-month differences of D11 exceed 3.0%, then the series is usually not stable. Span reports S 6.A through S 6.C give the various breakdowns for the number of times the MPD exceeds these levels.
Copyright © 2008 by SAS Institute Inc., Cary, NC, USA. All rights reserved.