Creating Reports from Table Data
Overview
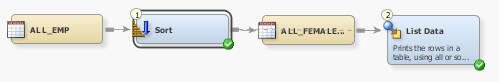
The List Data transformation
provides an interface to the PRINT procedure. The PRINT procedure
prints the observations in a SAS data set, using all or some of the
variables. You can create a variety of reports ranging from a simple
listing to a highly customized report that groups the data and calculates
totals and subtotals for numeric variables. You can also use it to
write the contents of a table (including a temporary output table)
to a report. The PRINT procedure enables you to control many aspects
of how the report is created, including the following:
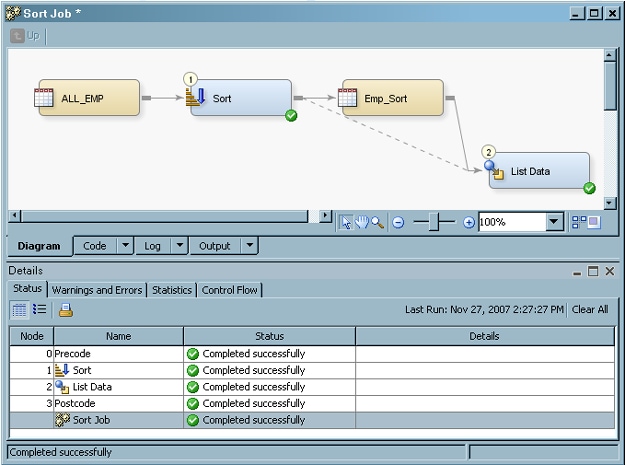
Generally, the List
Data generated transformation comes at the end of a process flow diagram
and prints data from the last table in the job. However, the transformation
produces a temporary output table whose contents are identical to
the contents of the input table, so you can use the transformation
to create a report that is based on the temporary output table.
Solution
You can use the List
Data transformation as an interface to the PRINT procedure in a job
that generates a report. For example, you can create a job similar
to the sample job featured in this topic. This sample job sorts the
data in a table that contains information about employees by sex and
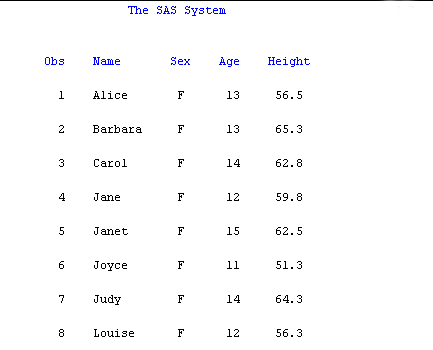
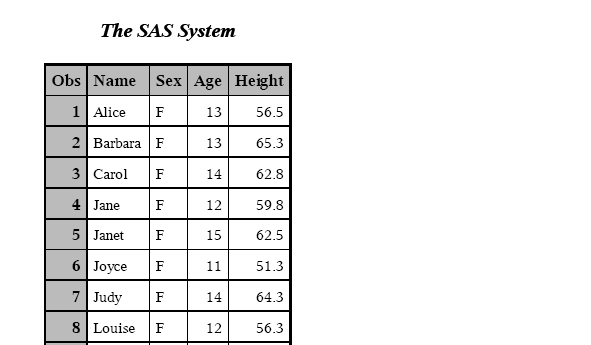
name. Note that the output for this job is sent to the Output tab in the Job Editor window and to an ODS document that is configured in the job. The
sample job includes the following tasks:
Tasks
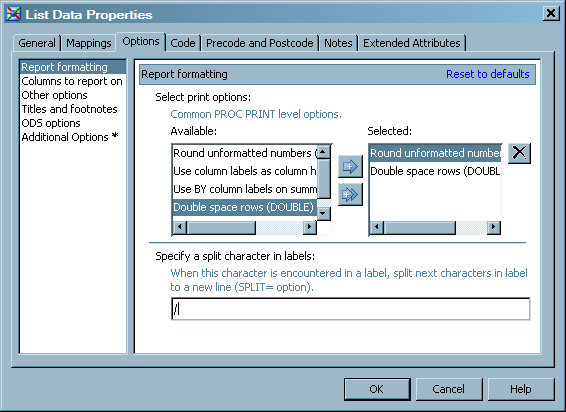
Configure Analytical Options
Use the Options tab in the properties window for the List Data
transformation to configure the output for your analysis. Note that
the Options tab is divided into two parts,
with a list of categories on the left side and the options for the
selected category on the right side. Perform the following steps to
set the options that you need for your job:
-
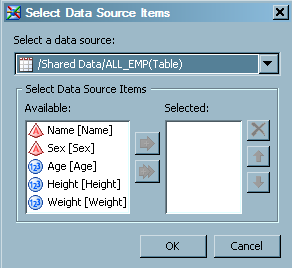
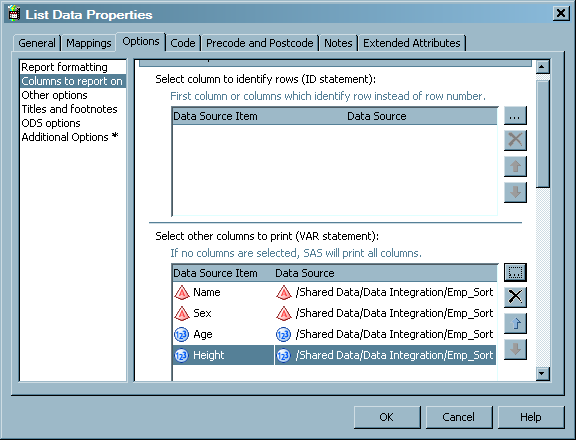
Click Columns to report on to access the Columns to report on page. Use the column selection prompts to access the columns that you need for your job. For example, you can click
 for the Select other columns to print
(VAR statement) field to access the Select
Data Source Items window, as shown in the following display:
for the Select other columns to print
(VAR statement) field to access the Select
Data Source Items window, as shown in the following display:
Configure Reporting Options
Use the remaining option
pages to create and save an HTML, RTF, or PDF version of the output
from the List Data transformation. Perform the following steps to
set options for the document:
-
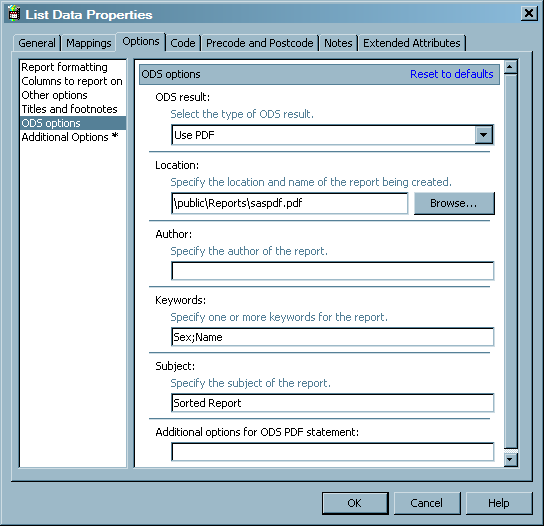
Click ODS options to access the ODS options page. You can choose between HTML, RTF, and PDF output and enter appropriate settings for each. The sample job uses PDF output. Therefore, a location, a set of keywords, and the subject of the report are added to the fields that are displayed when Use PDF is selected in the ODS result field. (The path specified in the Location field is relative to the SAS Application Server that executes the job.) These fields are shown in the following display:
Copyright © SAS Institute Inc. All rights reserved.