Desktop

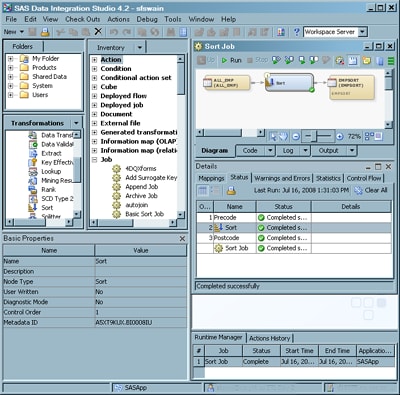
After you open a connection profile, the SAS Data Integration Studio desktop displays. The following display shows a typical desktop.
SAS Data Integration Studio Desktop
The main components of the desktop are described in the following table.
Desktop Components
Component
Location
Description
Title bar
Top of the desktop
Shows the current version of SAS Data Integration Studio and the name of the current connection profile.
Menu bar
Under the title bar
Provides access to the drop-down menus. The list of active options varies according to the current work area and the kind of object that you select. Inactive options are disabled or hidden.
Toolbar
Under the menu bar
Provides access to shortcuts for items on the menu bar. The list of active options varies according to the current work area and the kind of object that you select. Inactive options are disabled or hidden.
Tree view
Left pane on the desktop
Provides access to the Basic Properties pane, Checkouts tree, Folders tree, Inventory tree, and Transformations tree. For more information, see Tree View.
Basic Properties pane
Bottom of the left pane on the desktop
Displays basic properties of an object that is selected in the tree view. To display this pane, select Viewthen selectBasic Properties from the desktop. For more information, see Properties Windows.
Status bar
Bottom of the desktop
Displays the name of the currently selected object, the name of the default SAS Application Server if one has been selected, the login ID and metadata identity of the current user, and the name of the current SAS Metadata Server.
To select a different SAS Application Server, double-click the name of that server to display a dialog box.
If the name of the SAS Metadata Server turns red, the connection is broken. In that case, you can double-click the name of the metadata server to display a dialog box that enables you to reconnect.
Job Editor
Right pane of the desktop
Used to create and maintain jobs in SAS Data Integration Studio. To display this window, right-click a job in the tree view, and select Open. For more information, see Job Editor.
Details pane
Under the Job Editor
Used to monitor and debug a job in the Job Editor. To display this pane, select Viewthen selectDetails from the desktop. For more information, see Details Pane.
Runtime Manager
Under the Details pane
Displays the run-time status of the current job, the last time that the job was executed in the current session, and the SAS Application Server that was used to execute the job. To display this pane, select Viewthen selectRuntime Manager from the desktop.
Actions History
Under the Details pane
Displays low-priority errors and warnings. To display this pane, select Viewthen selectActions History from the desktop.