The Job
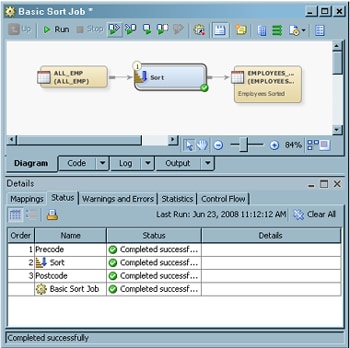
Editor window enables you to create, maintain, and troubleshoot SAS
Data Integration Studio jobs. To display this window, right-click
a job in the tree view and select
Open. The
following display shows a sample
Job Editor window.
The following
table describes the main tabs in the
Job Editor window.
Job Editor Tabs
|
|
|
|
|
Used to build
and update the process flow for a job.
|
|
Select Tools Options from
the desktop. On the General tab, select Show Code Tab.
|
Used to review
or update code for a job.
|
|
Select Tools Options from
the desktop. On the General tab, select Show Log Tab.
|
Used to review
the log for a submitted job.
|
|
Select Tools Options from the desktop. On the General tab, select Show Output Tab.
|
Used to review
the output of a submitted job.
|
The following
table describes a number of panes that can be used with the
Job Editor window.
Panes Used with the Job Editor
|
|
|
|
Select View Details from the desktop.
|
Used to monitor and debug a job
in the Job Editor. For more information, see Details Pane.
|
|
Select View Runtime Manager from the desktop.
|
Displays the run-time status of
the current job, the last time that the job was executed in the current
session, and the SAS Application Server that was used to execute the
job. This information is available as long as the job is active.
|
|
Select View Actions History from the desktop.
|
Displays low-priority errors and
warnings.
|
A modifier
icon called an icon overlay indicates that an object is in a certain
state or has special attributes. Put the cursor on an
overlay to view a description of what the overlay means. The following
table describes some of the overlay icons for metadata objects in
the
Job Editor window.
|
|
|
A horizontal
green triangle in the upper-right corner of the icon for a transformation
indicates that a checkpoint has been added to the transformation.
Checkpoints are used to restart jobs.
|
|
A rectangle in
the upper-right corner of the icon specifies the data format of the
table, such as SAS or Teradata.
|