SAS Code Node
Overview of the SAS Code Node
The SAS Code node enables
you to incorporate new or existing SAS code into process flow diagrams
that were developed using SAS Enterprise Miner. The SAS Code node
extends the functionality of SAS Enterprise Miner by making other
SAS System procedures available for use in your data mining analysis.
You can also write SAS DATA steps to create customized scoring code,
conditionally process data, or manipulate existing data sets. The
SAS Code node is also useful for building predictive models, formatting
SAS output, defining table and plot views in the user interface, and
for modifying variables metadata. The SAS Code node can be placed
at any location within a SAS Enterprise Miner a process flow diagram.
By default, the SAS Code node does not require data. The exported
data that is produced by a successful SAS Code node run can be used
by subsequent nodes in a process flow diagram.
SAS Code Node Properties
SAS Code Node General Properties
The following general
properties are associated with the SAS Code Node:
-
Node ID — The Node ID property displays the ID that SAS Enterprise Miner assigns to a node in a process flow diagram. Node IDs are important when a process flow diagram contains two or more nodes of the same type.
-
Imported Data — Select the
 button to open a table of SAS data sets that are
imported into the SAS Code node.
If data exists for an imported data source, you can select the row in the imported data table and click one of the following buttons:
button to open a table of SAS data sets that are
imported into the SAS Code node.
If data exists for an imported data source, you can select the row in the imported data table and click one of the following buttons:-
Browse to open a window where you can browse the data set.
-
Explore to open the Explore window, where you can sample and plot the data.
-
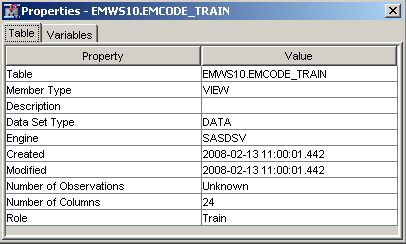
Properties to open the Properties window for the data source. The Properties window contains a Table tab and a Variables tab. The tabs contain summary information (metadata) about the table and variables.
-
-
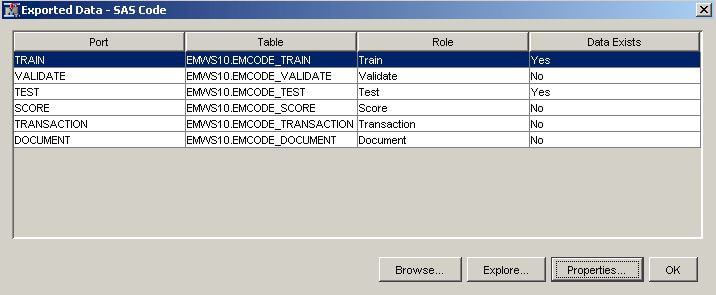
Exported Data — Select the button to open a table of SAS data sets that are
exported data by the SAS Code node.
If data exists for an exported data set, you can select the row in the table and click one of the following buttons:
-
Browse to open a window where you can browse the data set.
-
Explore to open the Explore window, where you can sample and plot the data.
-
Properties to open the Properties window for the data source. The Properties window contains a Table tab and a Variables tab. The tabs contain summary information (metadata) about the table and variables.
-
-
Notes — Select the button to the right of the Notes property to open
a window that you can use to store notes of interest, such as data
or configuration information.
SAS Code Node Train Properties
The following train
properties are associated with the SAS Code node:
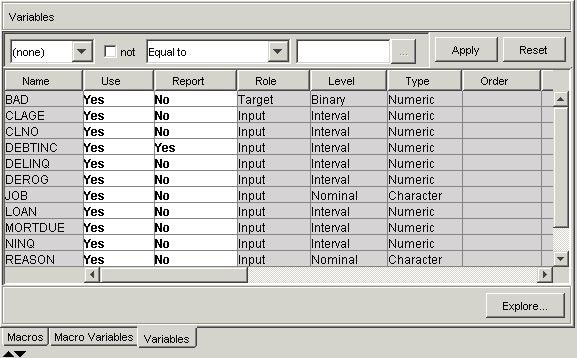
-
Variables — Use the Variables table to specify the status for individual variables that are imported into the SAS Code node. Select the button to open a window containing the variables
table. You can set the Use and Report status for individual variables,
view the columns metadata (or open an Explore window)
to view a variable's sampling information, observation values, or
a plot of variable distributions. You can apply a filter based on
the variable metadata column values so that only a subset of the variables
is displayed in the table.
-
Code Editor — Select the button to open the Code Editor. You can use the Code
Editor to edit and submit code interactively while viewing the SAS
log and output listings. You can also run a process flow diagram path
up to and including the SAS Code node and view the Results window
without closing the programming interface. For more details, see the
Code Editor section below.
-
Tool Type — specifies the node type using the SAS Enterprise Miner SEMMA framework. Valid values are:
-
Sample
-
Explore
-
Modify
-
Model
-
Assess
-
Utility
The default setting for the Tool Type property is Utility. When the Tool Type is set to Model, SAS Enterprise Miner creates a target profile for the node is none exists. It also creates a report data model that is appropriate for a modeling node. Doing so allows SAS Enterprise Miner to automatically generate assessment results provided certain variables are found in the scored data set (P_, I_, F_, R_ (depending on the target level)). See Predictive Modeling for more details about these variables and other essential information about modeling nodes. -
-
Data Needed — specifies whether the node needs at least one predecessor node. Valid values are Yes and No. The default setting for the Data Needed property is No.
-
Rerun — specifies whether the node should rerun each time the process flow is executed, regardless of whether the node has run before or not. Valid values are Yes and No. The default setting for the Rerun property of the SAS Code node is No.
-
Use Priors — specifies whether the posterior probability values are adjusted by the prior probability values. Valid values for the Use Priors property are Yes and No. The default setting for the Use Priors property is Yes.
SAS Code Node Score Properties
The following score
properties are associated with the SAS Code node.
-
Advisor Type — specifies the type of SAS Enterprise Miner input data advisor to be used to set the initial input variable measurement levels and roles. Valid values are
-
Basic — any new variables that are created by the node will inherit Basic metadata attributes. These attributes include
-
character variables are assigned a Level of Nominal
-
numeric variables are assigned a Level of Interval
-
variables are assigned a Role of Input
-
-
Advanced — variable distributions and variable attributes are used to determine the variable level and role attributes of newly created variables.
The default setting for the Advisor Type property is Basic. You can also control the metadata programmatically by writing SAS code to the file CDELTA_TRAIN.sas. There is also a feature that permits a user to create a data set that predefines metadata for specific variable names. This data set must be named COLUMNMETA and it must be stored in the EMMETA library. -
-
Publish Code — specifies the file that should be used when collecting the scoring code to be exported. Valid values are
-
Flow — Flow scoring code is used to score SAS data tables inside the process flow diagram. The scoring code is written to EMFLOWSCORE.sas.
-
Publish — Publish scoring code is used to publish the SAS Enterprise Miner model to a scoring system outside the process flow diagram. The scoring code is written to EMPUBLISHSCORE.sas.
The default setting of the Publish Code property is Publish. It is possible to have scoring code that is used within the process flow (Flow code) and different code that is used to score external data (Publish code). For example, when generating Flow code for modeling nodes, the scoring code can reference the observed target variable and you can generate residuals from a statistical model. Since Publish code is destined to be used to score external data where the target variable is unobserved, residuals from a statistical model cannot be generated. -
-
Code Format — specifies the format of the score code to be generated. Valid values are
-
DATA step — The score code contains only DATA step statements.
-
Other — The score code contains statements other than DATA step statements, such as PROC step statements.
The default setting for the Code Format property is DATA step. It is necessary to make the distinction because nodes such as the Ensemble node and the Score node collect score code from every predecessor node in the process flow diagram. If all of the predecessor nodes generate only DATA step score code, then the score code from all of the nodes in the process flow diagram can simply be appended together. However, if PROC step statements are intermixed in the score code in any of the predecessor nodes, a different algorithm must be used. -
SAS Code Node Status Properties
The following status
properties are associated with this node:
-
Create Time — displays the time at which the node was created.
-
Run ID — displays the identifier of the node run. A new identifier is created every time the node runs.
-
Last Error — displays the error message from the last run.
-
Last Status — displays the last reported status of the node.
-
Last Run Time — displays the time at which the node was last run.
-
Run Duration — displays the length of time of the last node run.
-
Grid Host — displays the grid server that was used during the node run.
-
User-Added Node — specifies if the node was created by a user as a SAS Enterprise Miner extension node.
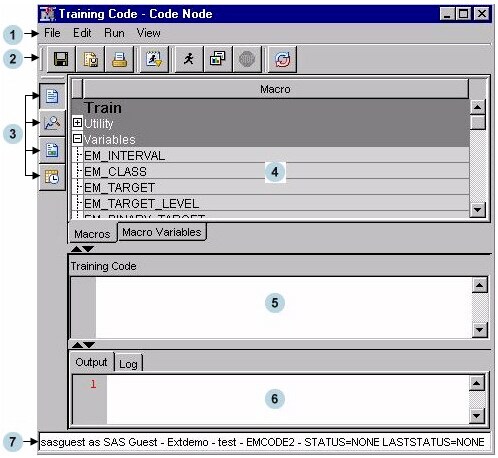
Code Editor Overview
You use the Code Editor
to enter SAS code that executes when you run the node. The editor
provides separate panes for Train, Score, and Report code. You can
edit and submit code interactively in all three panes while viewing
the SAS log and output listings. You can also run the process flow
diagram path up to and including the SAS Code node and view the Results window
without closing the programming interface.
The Code Editor provides
tables of macros and macro variables that you can use to integrate
your SAS code with the SAS Enterprise Miner environment. You use the
macro variables and the variables macros to reference information
about the imported data sets, the target and input variables, the
exported data sets, the files that store the scoring code, the decision
metadata, and so on. You use the utility macros, which typically accept
arguments, to manage data and format output. You can insert a macro
variable, a variables macro, or a utility macro into your code without
having to enter its name; you simply select an item from the macro
variables list or macros table and drag it to the active code pane.
If an imported data
set exists, you can access the variables table from the Code Editor.
The variables table has the same functionality regardless of whether
it is accessed from the Code Editor or the SAS Code node's Properties
panel.
You can also access
the SAS Code node's Properties panel from the Code Editor. You can
specify values for any of the node's properties in the Code Editor's
properties interface the same way you would in the SAS Code node's
Properties panel.
Code Editor User Interface
Introduction
Menu
The Code Editor menu
consists of the following items:
-
File
-
Save — save the contents in the current view of the code pane.
-
Save As — saves any combination of the code, output, or log.
-
Save All — saves the code, output, and log.
-
Print — print the contents of the pane that currently has the focus.
-
Exit — close the Code Editor window and return to the SAS Enterprise Miner main workspace.
-
-
Edit
-
Cut — deletes the selected item and copies it to the clipboard.
-
Copy — copies the selected item to the clipboard.
-
Paste — pastes a copied item from the clipboard.
-
Select All — selects all of the text from the code pane.
-
Clear All — clears all of the text from the current code pane.
-
Find and Replace — opens the Find/Replace dialog box allowing you to search for and replace text in the code, output, and log.
-
-
Run
-
Run Code — runs the code in the active code pane. This does not affect the status of the node or the process flow. It is simply a way to validate your code.
-
Run Node — runs the SAS Code node and any predecessor nodes in the process flow that have not been executed.
-
Results — open the SAS Code node's Results window.
-
Stop Node — interrupts a currently running process flow.
-
-
View
-
Training Code — views the Training Code pane.
-
Score Code — views the Score Code pane.
-
Report Code — views the Report Code pane.
-
Properties — open the SAS Code node Properties panel.
-
Toolbar
-
 — saves the contents in the current view
of the code pane
— saves the contents in the current view
of the code pane
-
 — saves the contents of the code pane, the
output, and the SAS log
— saves the contents of the code pane, the
output, and the SAS log
-
 — prints the contents of the code pane, the
output, or the SAS log
— prints the contents of the code pane, the
output, or the SAS log
-
 — runs the code in the active code pane
-
 — runs the SAS Code node and any predecessor
nodes in the process flow that have not been executed
— runs the SAS Code node and any predecessor
nodes in the process flow that have not been executed
-
 — opens the SAS Code node's Results window
-
 — stops a currently running process flow
diagram
— stops a currently running process flow
diagram
-
 — resets the workspace
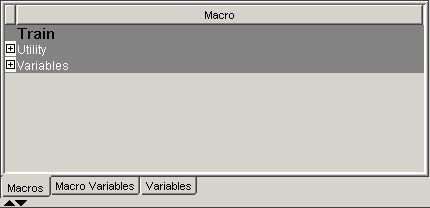
Tables Pane
-
Macros — Click the Macros tab to view a table of macros in the Tables pane. The macro variables are arranged in two groups: Utility and Variables. Click on the plus or minus sign on the left of the group name to expand or collapse the list, respectively. You can insert a macro into your code without entering its name by selecting an item from the macros table, and dragging it to the code pane.
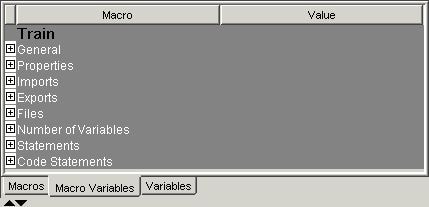
-
Macro Variables — Click the Macro Variables tab to view a table of macro variables in the Tables pane. You can use the split bar to adjust the width of the columns in the table. For many of the macro variables, you will see the value to which it resolves in the Value column. But in some cases, the value cannot be displayed in the table since those macro variables are populated at run time.The macro variables are arranged in groups according to function:
-
General — Use general macro variables to retrieve system information.
-
Properties — Use properties macro variables to retrieve information about the nodes.
-
Imports — Use imports macro variables to identify the SAS tables that are imported from predecessor nodes at run time.
-
Exports — Use exports macro variables to identify the SAS tables that are exported to successor nodes at run time.
-
Files — Use files macro variables to identify external files that are managed by SAS Enterprise Miner, such as log and output listings.
-
Number of Variables — Use number of variables macro variables for a given combination of the measurement levels and model roles.
-
Statements — Use statements macro variables to identify SAS program statements that are frequently used by SAS Enterprise Miner, such as the decision statement in the modeling procedures.
-
Code Statements — Use the Code Statements macro variable to identify the file containing the Code statement.
You can insert a macro variable into your code without entering its name by selecting an item from the macro variables table, and dragging it to the code pane. -
Code Pane
The Code pane has three
views: Training Code, Score Code, and Report Code.
Click on the  (Training),
  (Score), or
  (Report) icons on the toolbar to choose the pane
in which you want to work.
(Report) icons on the toolbar to choose the pane
in which you want to work.
The code from the three
panes is executed sequentially when you select Run Node ( ). Training code is executed first, followed by
Score code, and then Report code. If you select Run Code ( ), only the code in the visible code pane is executed.
For more details, see the Code Pane section.
). Training code is executed first, followed by
Score code, and then Report code. If you select Run Code ( ), only the code in the visible code pane is executed.
For more details, see the Code Pane section.
Use the  controls to either expand (
 ) or collapse (
 ) the Code pane.
controls to either expand () or collapse () the Code pane.
Results Pane
The Results pane has
two tabs: Output and Log. Click the Output tab
to view the output generated by your code or click the Log tab
to view the SAS Log that was generated by your code. If you run the
node (), rather than just your code (), the output and log must be viewed from the SAS
Code node's Results window () and not from the Code Editor's Results pane.
), rather than just your code (), the output and log must be viewed from the SAS
Code node's Results window () and not from the Code Editor's Results pane.
Use the controls to either expand () or collapse () the Results pane.
controls to either expand () or collapse () the Results pane.
Status Bar
The status bar displays
the following:
-
SAS User ID — the SAS User ID of the current SAS Enterprise Miner session owner.
-
User name — the User name that is associated with the current SAS Enterprise Miner session owner.
-
Project name — the name of the currently open SAS Enterprise Miner project.
-
Diagram name — the name of the currently open SAS Enterprise Miner diagram.
-
Node name — the name of the selected node in the current SAS Enterprise Miner diagram workspace.
-
Current status — the current status of the selected node in the current SAS Enterprise Miner diagram workspace.
-
Last status — the last known status of the selected node in the current SAS Enterprise Miner diagram workspace.

Code Editor Macros
Overview
The Macros table lists
the SAS macros that are used to encode multiple values, such as a
list of variables, and functions that are already programmed in SAS
Enterprise Miner. The macro variables are arranged in two groups:
Utility and Variables. Utility macros are used to manage data and
format output and Variables macros are used to identify variable definitions
at run time. The macros discussion below is organized as follows:
-
-
%EM_REGISTER
-
%EM_REPORT
-
%EM_MODEL
-
%EM_DATA2CODE
-
%EM_DECDATA
-
%EM_CHECKMACRO
-
%EM_CHECKSETINIT
-
%EM_ODSLISTON
-
%EM_ODSLISTOFF
-
%EM_METACHANGE
-
%EM_GETNAME
-
%EM_CHECKERROR
-
%EM_PROPERTY
-
Utility Macros
Use utility macros to
manage data and format output.
The following utility
macros are available:
-
%EM_REGISTER — Use the %EM_REGISTER macro to register a unique file key. When you register a key, SAS Enterprise Miner generates a macro variable named &EM_USER_key. You then use &EM_USER_key in your code to associate a file with the key. Registering a file allows SAS Enterprise Miner to track the state of the file, avoid name conflicts, and ensure that the registered file is deleted when the node is deleted from a process flow diagram.%EM_REGISTER allows the following arguments:
-
ACTION = < TRAIN | SCORE | REPORT > — associates the registered CATALOG, DATA, FILE, or FOLDER with an action. If the registered object is modified, the associated action is triggered to execute whenever the node is run subsequently. The default value is TRAIN. This is an optional argument. The argument has little use in the SAS Code node but can be of significant value to extension node developers.
-
AUTODELETE = <Y|N> — Request the delete status of the file prior to the run. This argument is optional.
-
EXTENSION = <file-extension> — an optional parameter to identify nonstandard file extensions (.sas or .txt, for example).
-
FOLDER = <folder-key> — the folder key where a registered file resides (optional).
-
KEY = <data-key> — an alias for a filename.
-
PROPERTY = <Y|N> — an optional argument that indicates that the file is a node property and that when the node or the process flow diagram is exported, the content of the registered file will also be exported with the rest of the properties.
-
TYPE = <CATALOG | DATA | FILE | FOLDER> — the type of file that is to be registered.
For example, if you want to use the data set Class from the SASHELP library, register the key Class:%em_register(key=Class, type=data);
Later, in your code, you can use statements such as the following:data &em_user_Class; set Sashelp.Class;
Then, references to &EM_USER_Class will resolve to the permanent data set Sashelp.Class. -
-
%EM_REPORT — Use the %EM_REPORT macro to specify the contents of a results window display created using a registered data set. The display contents, or view, can be a data table view or a plot view. Examples of plot types are histogram, bar chart, and line plots. The views (both tables and plots) appear in the results window of the SAS Code node and in any results package files (SPK files).%EM_REPORT allows the following arguments:
-
AUTODISPLAY = <Y | N> — specifies whether the report displays automatically when the results viewer is opened.
-
BLOCK = <group-name> — specifies the group that the report belongs to when the results viewer is opened. The default setting is CUSTOM.
-
COLOR = <variable-name> — specifies a variable that contains color value.
-
COMPARE = <Y | N> — specifies whether data in the generated report can be used to compare registered models. The default setting is N.
-
DESCRIPTION = <window-title-description> — specifies a text string or report description that will appear in the window title.
-
DISCRETEX = <Y | N> — specifies whether the values on the x-axis will be discrete when the VIEWTYPE is HISTOGRAM.
-
DISCRETEY = <Y | N> — specifies whether the values on the y-axis will be discrete when the VIEWTYPE is HISTOGRAM.
-
EQUALIZECOLX = <Y | N> — specifies if the x-axis should be equalized (that is, use a shared common scale and tick marks) across columns of the lattice. The default setting is N.
-
EQUALIZECOLY = <Y | N> — specifies if the y-axis should be equalized across columns of the lattice. The default setting is N.
-
EQUALIZEROWX = <Y | N> — specifies if the x-axis should be equalized (that is, use a shared common scale and tick marks) across rows of the lattice. The default setting is N.
-
EQUALIZEROWY = <Y | N> — specifies if the y-axis should be equalized across rows of the lattice. The default setting is N.
-
FREQ = <frequency-variable-name> — specifies a frequency variable.
-
GROUP = <group-variable-name(s)> — specifies one or more grouping variables.
-
IDVALUE = <data-set-name> — specifies a data set. When a corresponding variable name is specified using the REPORTID argument, a report is generated for each value of the specified variable in the named data set. A report window is created for each unique value.
-
KEY = <data-key> (required) — specifies the data key. Since this is a required argument, you must assign the data key using %EM_REGISTER before using %EM_REPORT.
-
LATTICETYPE=<viewtype> — valid viewtypes are Data, Scatter, Lineplot, Bar, Histogram, Pie, Profileview, Gainsplot.
-
LATTICEX =<lattice-row-variable-name> — specifies variables to be used as rows in a lattice.
-
LATTICEY = <lattice-column-variable-name> — specifies variables to be used as columns in a lattice.
-
LOCALIZE = <Y | N> — specifies whether the description should be localized or used as-is. The default setting is N.
-
REPORTID = <variable-name> — specifies a variable name. When a corresponding data set name is specified using the IDVALUE argument, a report is generated for each value of the specified variable in the named data set. A report window is created for each unique value.
-
SPK = <Y | N> — specifies whether to include the report and data in an SPK package. The default setting is Y.
-
SUBGROUP = <subgroup-variable-name(s)> — specifies one or more sub-grouping variables.
-
TIPTEXT = <variable-name> — specifies a variable that contains tooltip text.
-
TOOLTIP = <variable-name> — specifies a variable containing tooltip text for the Constellation application.
-
VIEWS = <numeric-value> — assigns a numeric ID to the generated report.
-
VIEWTYPE = < plot-type > — specifies the type of plot that you want to display. Valid plot types include Data, Bar, Histogram, Lineplot, Pie, Profileview, Scatter, Gainsplot, Lattice, Dendrogram, and Constellation. Data is the default value.
-
WHERE = — specifies an explicit SQL WHERE clause.
-
X = <x-variable-name> — specifies the x-axis variable.
-
XREF = <numeric-value> — specifies a reference line on the x-axis.
-
Y = <y-variable-name> — specifies the y-axis variable.
-
Yn = <Yn-variable-name> — where n is an integer ranging from 1 to 16. Y1, Y2, ... , Y16 specify variables that are to be plotted and overlaid on the y-axis.
-
YREF = <numeric-name> — specifies a reference line on the y-axis.
-
Z = <z-variable-name> — specifies the z-axis variable of a 3-dimensional plot.
Examples using %EM_REPORT are provided below. -
-
%EM_MODEL — The %EM_MODEL macro enables you to control the computations that are performed and the score code that is generated by the SAS Enterprise Miner environment for modeling nodes.The macro supports the following arguments:
-
TARGET = <target-variable-name> — name of the target (required).
-
ASSESS = <Y|N> — assess the target. The default is Y.
-
DECSCORECODE = <Y|N> — generate decision score code. The default is N.
-
FITSTATISTICS = <Y|N> — compute fit statistics. The default is N.
-
CLASSIFICATION = <Y|N> — generate score code to generate classification variables (I_, F_, U_) . The default is N.
-
RESIDUALS = <Y|N> — generate score code to compute residuals. The default is N.
-
PREDICTED = <Y|N> — indicates whether the node generates predicted values. The default is Y.
For example, suppose you have a binary target variable named BAD and your code only generates posterior variables. You can use the %EM_MODEL macro to indicate that you want SAS Enterprise Miner to generate fit statistics, assessment statistics, and to generate score code that computes classification, residual, and decision variables.%em_model( target=BAD, assess=Y, decscorecode=Y, fitstatistics=Y, classification=Y, residuals=Y, predicted=Y);
Note: %EM_MODEL is available for use in your code but it does not currently appear in the Code Editor's table of macros. -
-
%EM_DATA2CODE — The %EM_DATA2CODE macro converts a SAS data set to SAS program statements. For example, it can be used to embed the parameter estimates that PROC REG creates directly into scoring code. The resulting scoring code can be deployed without need for an EST data set. You must provide the code to use the parameter estimates to produce a model score.%EM_DATA2CODE accepts the following arguments:
-
APPEND= <Y | N> — specifies whether to append or overwrite code if the specified file already exists.
-
DATA= <source-data-name> — specifies the source data.
-
OUTDATA= <output-data-set-name> — specifies the name of the output data set that is created when the DATA step code runs.
-
OUTFILE= <output-data-step-code-filename> — specifies the name of the output file that will contain the generated SAS DATA step code.
-
-
%EM_DECDATA — The %EM_DECDATA macro uses information that you entered to create the decision data set that is used by SAS Enterprise Miner modeling procedures. %EM_DECDATA copies the information to the WORK library and assigns the proper type (profit, loss, or revenue) for modeling procedures.
-
DECDATA = <decision-data-set> — specifies the data set containing the decision data set.
-
DECMETA = <decision-metadata — specifies the data set containing decision metadata.
-
NODEID = <node-identifier> — specifies the unique node identifier.
-
-
%EM_CHECKMACRO — Use the EM_CHECKMACRO macro to check for the existence of a macro variable. Assigning a value is optional.%EM_CHECKMACRO accepts the following arguments:
-
NAME = <macro-variable-name> — specifies the name of the macro variable for which you want to check.
-
GLOBAL = <Y | N> — specifies whether the named macro variable is a global macro variable.
-
VALUE = <variable-value> — specifies a value for the macro variable if it has not been previously defined.
-
-
%EM_CHECKSETINIT — Use the %EM_CHECKSETINIT macro to validate and view your SAS product licensing information.%EM_CHECKSETINIT has the following required argument:
-
PRODUCTID = <product id number> — specifies the product identification number. If the product specified is not licensed, SAS Enterprise Miner issues an error and halts execution of the program.
-
-
%EM_ODSLISTON — Use the %EM_ODSLISTON macro to turn the SAS Output Delivery System (ODS) listing on, and to specify a name for the destination HTML file.%EM_ODSLISTON accepts the following arguments:
-
FILE = <destination-file> — specifies the name of an HTML output file that will contain the generated ODS listing.
-
-
%EM_ODSLISTOFF — Use the %EM_ODSLISTOFF utility macro to turn SAS ODS listing off. No argument is needed for this macro.
-
%EM_METACHANGE — Use the %EM_METACHANGE macro to modify the columns metadata data set that is exported by a node. The macro should be called during either the TRAIN or SCORE actions.%EM_METACHANGE allows the following arguments:
-
NAME = <variable-name> — the name of the variable that you want to modify (required).
-
ROLE = <variable-role> — assign a new role to the variable (optional).
-
LEVEL = <UNARY | BINARY | ORDINAL | NOMINAL | INTERVAL> — assign a new measurement level to the variable (optional).
-
ORDER = <ASC | DESC | FMTASC | FMTDESC> — new level ordering for a class variable (optional).
-
COMMENT = <string>— string that can be attached to a variable (optional).
-
LOWERLIMIT = <number> — the lower limit of a numeric variable's valid range (optional).
-
UPPERLIMIT = <number> — the upper limit of a numeric variable's valid range.
-
DELETE = <Y|N> — indicate whether the variable should be removed from the metadata (optional).
-
-
%EM_GETNAME — Use %EM_GETNAME to retrieve the name of a file or data set that is registered to a given key. The macro initializes the EM_USER_key macro variable. This macro should be called in actions other than CREATE, rather than call the EM_REGISTER macro.%EM_GETNAME allows the following arguments:
-
KEY = <data-key> — the registered data key
-
TYPE = <CATALOG | DATA | FILE | FOLDER | GRAPH> — the type of file that is registered.
-
EXTENSION = <file-extension> — an optional parameter to identify nonstandard file extensions.
-
FOLDER = <folder-key> — the folder key where a registered file resides (optional).
-
-
%EM_CHECKERROR — This macro checks the return code and initializes the &EMEXCEPTIONSTRING macro variable. %EM_CHECKERROR has no arguments.
-
%EM_PROPERTY — Use %EM_PROPERTY in the CREATE action to initialize the &EM_PROPERTY_name macro variable for the specified property. The macro enables you to specify the initial value to which &EM_PROPERTY_name will resolve. You can also associate the property with a specific action (TRAIN, SCORE, or REPORT).%EM_PROPERTY allows the following arguments:
-
NAME = <property name> — specify the name of the property that is to be initialized (required). This is case sensitive and must match the property name that is specified in the XML properties file.
-
VALUE = <initial value> — specify the initial value for the property (required). The value should match the initial attribute that is specified for the property in the XML properties file.
-
ACTION = <TRAIN | SCORE | REPORT> — specify the action that is associated with the property (optional).
-
Variables Macros
Use the variables macros
to identify variable definitions at run time. Variables appear in
these macros only if the variable's Use or Report status is set to
Yes.
-
%EM_INTERVAL — resolves to the input variables that have an interval measurement level. Interval variables are continuous variables that contain values across a range.
-
%EM_CLASS — resolves to the categorical input variables, including all inputs that have a binary, nominal, or ordinal measurement level.
-
%EM_TARGET — resolves to the variables that have a model role of target. The target variable is the dependent or the response variable.
-
%EM_TARGET_LEVEL — resolves to the measurement level of the target variable.
-
%EM_BINARY_TARGET — resolves to the binary variables that have a model role of target.
-
%EM_ORDINAL_TARGET — resolves to the ordinal variables that have a model role of ordinal.
-
%EM_NOMINAL_TARGET — resolves to the nominal variables that have a model role of nominal.
-
%EM_INTERVAL_TARGET — resolves to the interval variables that have a model role of target.
-
%EM_INPUT — resolves to the variables that have a model role of input. The input variables are the independent or predictor variables.
-
%EM_BINARY_INPUT — resolves to the binary variables that have a model role of input.
-
%EM_ORDINAL_INPUT — resolves to the ordinal variables that have a model role of input.
-
%EM_NOMINAL_INPUT — resolves to the nominal variables that have a model role of input.
-
%EM_INTERVAL_INPUT — resolves to the interval variables that have a model role of input.
-
%EM_REJECTED — resolves to the variables that have a model role of REJECTED.
-
%EM_BINARY_REJECTED — resolves to the binary variables that have a model role of rejected.
-
%EM_ORDINAL_REJECTED — resolves to the ordinal variables that have a model role of rejected.
-
%EM_NOMINAL_REJECTED — resolves to the nominal variables that have a model role of rejected.
-
%EM_INTERVAL_REJECTED — resolves to the interval variables that have a model role of rejected.
-
%EM_ASSESS — resolves to the variables that have a model role of assessment.
-
%EM_CENSOR — resolves to the variables that have a model role of censor.
-
%EM_CLASSIFICATION — resolves to the variables that have a model role of classification.
-
%EM_COST — resolves to the variables that have a model role of cost.
-
%EM_CROSSID — resolves to the variables that have a model role of Cross ID.
-
%EM_DECISION — resolves to the variables that have a model role of decision.
-
%EM_FREQ — resolves to the variables that have a model role of freq.
-
%EM_ID — resolves to the variables that have a model role of ID.
-
%EM_LABEL — resolves to the variables that have a model role of label.
-
%EM_PREDICT — resolves to the variables that have a model role of prediction.
-
%EM_REFERRER — resolves to the variables that have a model role of referrer.
-
%EM_REJECTS — resolves to the variables that have a model role of REJECTED. This macro is equivalent to %EM_REJECTED.
-
%EM_REPORT_VARS — resolves to the variables that have a model role of report.
-
%EM_CLASS_REPORT — resolves to the class variables that have a model role of report.
-
%EM_INTERVAL_REPORT — resolves to the interval variables that have a model role of report.
-
%EM_RESIDUAL — resolves to the variables that have a model role of residual.
-
%EM_SEGMENT — resolves to the variables that have a model role of segment.
-
%EM_SEQUENCE — resolves to the variables that have a model role of sequence.
-
%EM_TEXT — resolves to the variables that have a model role of text.
-
%EM_TIMEID — resolves to the variables that have a model role of Time ID.
Macro Variables
Overview
General
Use general macro variables
to retrieve system information.
-
&EM_USERID — resolves to the user name.
-
&EM_METAHOST — resolves to the host name of SAS Metadata Repository.
-
&EM_METAPORT — resolves to the port number of SAS Metadata Repository.
-
&EM_LIB — resolves to the numbered EMWS SAS library that contains the data sets and SAS catalogs related to the current process flow diagram. This will be the same as the value of the process flow diagram's ID property.
-
&EM_DSEP — resolves to the operating system file delimiter (for example, backslash (\) for Windows and slash (/) for UNIX).
-
&EM_CODEBAR — resolves to the macro variable that identifies a code separator.
-
&EM_VERSION — resolves to the version of SAS Enterprise Miner.
-
&EM_TOOLTYPE — resolves to the node type (Sample | Explore | Modify | Model | Assess |Utility).
-
&EM_NODEID — resolves to the node ID.
-
&EM_NODEDIR — resolves to the path to the node folder.
-
&EM_SCORECODEFORMAT — resolves to the format of the score code (DATASTEP | OTHER).
-
&EM_PUBLISHCODE — resolves to the Publish Code property (FLOW | PUBLISH).
-
&EM_META_ADVISOR — resolves to the Advisor Type property (BASIC | ADVANCED). This is equivalent to &EM_PROPERTY_MetaAdvisor.
-
&EM_MININGFUNCTION — resolves to a description of the function of the node.
Properties
Use properties macro
variables to retrieve information about the nodes.
-
&EM_PROPERTY_ScoreCodeFormat — resolves to the value of the Code Format property.
-
&EM_PROPERTY_MetaAdvisor — resolves to the value of the Advisor Type property. This is equivalent to &EM_Meta_Advisor.
-
&EM_PROPERTY_ForceRun — resolves to Y or N. When set to Y the node and its successors will rerun even though no properties, variables or imports have changed.
-
&EM_PROPERTY_UsePriors — resolves to the value of the Use Priors property.
-
&EM_PROPERTY_ToolType — resolves to the value of the Tool Type property.
-
&EM_PROPERTY_DataNeeded — resolves to the value of the Data Needed property.
-
&EM_PROPERTY_VariableSet — resolves to the name of the catalog containing the VariableSet.
-
&EM_PROPERTY_PublishCode — resolves to the value of the Publish Code property.
-
&EM_PROPERTY_NotesFile — resolves to the name of the file containing the contents of the Notes Editor.
-
&EM_PROPERTY_Component — resolves to the SAS Enterprise Miner node name.
-
&EM_PROPERTY_RunID — resolves to the value of the Run ID property. Each time the node is run a new ID is generated.
Imports
Use imports macro variables
to identify the SAS tables that are imported from predecessor nodes
at run time.
-
&EM_IMPORT_DATA — resolves to the name of the training data set.
-
&EM_IMPORT_DATA_CMETA — resolves to the name of the column metadata data set that corresponds to the training data set.
-
&EM_IMPORT_VALIDATE — resolves to the name of the validation data set.
-
&EM_IMPORT_VALIDATE_CMETA — resolves to the name of the column metadata data set that corresponds to the validation data set.
-
&EM_IMPORT_TEST — resolves to the name of the test data set.
-
&EM_IMPORT_TEST_CMETA — resolves to the name of the column metadata data set that corresponds to the test data set.
-
&EM_IMPORT_SCORE — resolves to the name of the score data set.
-
&EM_IMPORT_SCORE_CMETA — resolves to the name of the column metadata data set that corresponds to the score data set.
-
&EM_IMPORT_TRANSACTION — resolves to the name of the transaction data set.
-
&EM_IMPORT_TRANSACTION_CMETA — resolves to the name of the column metadata data set that corresponds to the transaction data set.
-
&EM_IMPORT_DOCUMENT — resolves to the name of the document data set.
-
&EM_IMPORT_DOCUMENT_CMETA — resolves to the name of the column metadata data set that corresponds to the document data set.
-
&EM_IMPORT_RULES — resolves to the name of the rules data set that is exported from a predecessor Association or Path Analysis node.
-
&EM_IMPORT_REPORTFIT — resolves to the name of the fit statistics data set.
-
&EM_IMPORT_RANK — resolves to the name of the rank data set.
-
&EM_IMPORT_SCOREDIST — resolves to the name of the score distribution data set.
-
&EM_IMPORT_ESTIMATE — resolves to the name of the parameter estimates data set.
-
&EM_IMPORT_TREE — resolves to the name of the tree data set from a predecessor modeling node.
-
&EM_IMPORT_CLUSSTAT — resolves to the name of the cluster statistics data set from a predecessor Cluster node.
-
&EM_IMPORT_CLUSMEAN — resolves to the name of the cluster mean data set from a predecessor Cluster node.
-
&EM_IMPORT_VARMAP — resolves to the name of the data set of variable mapping from a predecessor Cluster node.
-
&EM_METASOURCE_NODEID — resolves to the node ID that is providing the variables metadata.
-
&EM_METASOURCE_CLASS — resolves to the class of the node.
-
&EM_METASOURCE_CHANGED — resolves to Y or N, indicating whether the source of the metadata has changed.
Exports
Use exports macro variables
to identify the SAS tables that are exported to successor nodes at
run time.
-
&EM_EXPORT_TRAIN — resolves to the name of the export training data set.
-
&EM_TRAIN_SCORE — resolves to Y or N, indicating whether SAS Enterprise Miner should score the training data set.
-
&EM_TRAIN_DELTA — resolves to Y or N, indicating whether the metadata DATA step code will be used to modify the training column metadata data set.
-
&EM_EXPORT_TRAIN_CMETA — resolves to the name of the column metadata data set that corresponds to the export training data set.
-
&EM_EXPORT_VALIDATE — resolves to the name of the export validation data set.
-
&EM_VALIDATE_SCORE — resolves to Y or N, indicating whether the score code will be used to create the output validation data set.
-
&EM_VALIDATE_DELTA — resolves to Y or N, indicating whether the metadata DATA step code will be used to modify the validation column metadata data set.
-
&EM_EXPORT_VALIDATE_CMETA — resolves to the name of the column metadata data set that corresponds to the export validation data set.
-
&EM_EXPORT_TEST — resolves to the name of the export test data set.
-
&EM_TEST_SCORE — resolves to Y or N, indicating whether the score code will be used to create the output test data set.
-
&EM_TEST_DELTA — resolves to Y or N, indicating whether the metadata DATA step code will be used to modify the test column metadata data set.
-
&EM_EXPORT_TEST_CMETA — resolves to the name of the column metadata data set that corresponds to the export test data set.
-
&EM_EXPORT_SCORE — resolves to the name of the export score data set.
-
&EM_SCORE_SCORE — resolves to Y or N, indicating whether the score code will be used to create the output score data set.
-
&EM_SCORE_DELTA — resolves to Y or N, indicating whether the metadata DATA step code will be used to modify the score column metadata data set.
-
&EM_EXPORT_SCORE_CMETA — resolves to the name of the column metadata data set that corresponds to the export score data set.
-
&EM_EXPORT_TRANSACTION — resolves to the name of the export transaction data set.
-
&EM_TRANSACTION_SCORE — resolves to Y or N, indicating whether the score code will be used to create the output transaction data set.
-
&EM_TRANSACTION_DELTA — resolves to Y or N, indicating whether the metadata DATA step code will be used to modify the transaction column metadata data set.
-
&EM_EXPORT_TRANSACTION_CMETA — resolves to the name of the column metadata data set that corresponds to the export transaction data set.
-
&EM_EXPORT_DOCUMENT — resolves to the name of the export document data set.
-
&EM_DOCUMENT_SCORE — resolves to Y or N, indicating whether the score code will be used to create the output document data set.
-
&EM_DOCUMENT_DELTA — resolves to Y or N, indicating whether the metadata DATA step code will be used to modify the document column metadata data set.
-
&EM_EXPORT_DOCUMENT_CMETA — resolves to the name of the column metadata data set that corresponds to the export document data set.
Files
Use files macro variables
to identify external files that are managed by SAS Enterprise Miner,
such as log and output listings. Not all nodes create or manage all
external files.
-
&EM_DATA_IMPORTSET — resolves to the name of the data set containing metadata for the imported data sets.
-
&EM_DATA_EXPORTSET — resolves to the name of the data set containing metadata for the exported data sets.
-
&EM_DATA_VARIABLESET — resolves to the data set containing metadata for the variables that are available for use with the node.
-
&EM_DATA_ESTIMATE — resolves to the name of the parameter estimates data set.
-
&EM_DATA_EMTREE — resolves to the name of the tree data set.
-
&EM_DATA_EMREPORTFIT — resolves to the name of the fit statistics data set in columns format.
-
&EM_DATA_EMOUTFIT — resolves to the name of the fit statistics data set.
-
&EM_DATA_EMCLASSIFICATION — resolves to the name of the data set that contains classification statistics for categorical targets.
-
&EM_DATA_EMRESIDUAL — resolves to the name of the data set that contains summary statistics for residuals for interval targets.
-
&EM_DATA_EMRANK — resolves to the name of the data set that contains assessment statistics such as lift, cumulative lift, and profit.
-
&EM_DATA_EMSCOREDIST — resolves to the name of the data set that contains assessment statistics such as mean, minimum, and maximum.
-
&EM_DATA_INTERACTION — resolves to the name of the interaction data set.
-
&EM_DATA_EMTRAINVARIABLE — resolves to the name of the training variable data set.
-
&EM_CATALOG_EMNODELABEL — resolves to the name of the node catalog.
-
&EM_FILE_EMNOTES — resolves to the name of the file containing your notes.
-
&EM_FILE_EMLOG — resolves to the name of the SAS Enterprise Miner output log file.
-
&EM_FILE_EMOUTPUT — resolves to the name of the SAS Enterprise Miner output data file.
-
&EM_FILE_EMTRAINCODE — resolves to the name of the file that contains the training code.
-
&EM_FILE_EMFLOWSCORECODE — resolves to the name of the file that contains the flow score code.
-
&EM_FILE_EMPUBLISHSCORECODE — resolves to the name of the file that contains the publish score code.
-
&EM_FILE_EMPMML — resolves to the name of the PMML file.
-
&EM_FILE_CDELTA_TRAIN — resolves to the name of the file that contains the DATA step code that is used to modify the column metadata associated with the training data set that is exported by a node (if one exists).
-
&EM_FILE_CDELTA_TRANSACTION — resolves to the name of the file that contains the DATA step code that is used to modify the column metadata associated with the transaction data set that is exported by a node (if one exists).
-
&EM_FILE_CDELTA_DOCUMENT — resolves to the name of the file that contains the DATA step code that is used to modify the column metadata associated with the document data set that is exported by a node (if one exists).
Number of Variables
Use number of variables
macro variables for a given combination of Level and Role. These macro
variables only count variables that have a Use or Report status of
Yes.
-
&EM_NUM_VARS — resolves to the number of variables.
-
&EM_NUM_INTERVAL — resolves to the number of interval variables.
-
&EM_NUM_CLASS — resolves to the number of class variables.
-
&EM_NUM_TARGET — resolves to the number of target variables.
-
&EM_NUM_BINARY_TARGET — resolves to the number of binary target variables.
-
&EM_NUM_ORDINAL_TARGET — resolves to the number of ordinal target variables.
-
&EM_NUM_NOMINAL_TARGET — resolves to the number of nominal target variables.
-
&EM_NUM_INTERVAL_TARGET — resolves to the number of interval target variables.
-
&EM_NUM_BINARY_INPUT — resolves to the number of binary input variables.
-
&EM_NUM_ORDINAL_INPUT — resolves to the number of ordinal input variables.
-
&EM_NUM_NOMINAL_INPUT — resolves to the number of nominal input variables.
-
&EM_NUM_INTERVAL_INPUT — resolves to the number of interval input variables.
-
&EM_NUM_BINARY_REJECTED — resolves to the number of rejected binary input variables.
-
&EM_NUM_ORDINAL_REJECTED — resolves to the number of rejected ordinal input variables.
-
&EM_NUM_NOMINAL_REJECTED — resolves to the number of rejected nominal input variables.
-
&EM_NUM_INTERVAL_REJECTED — resolves to the number of rejected interval input variables.
-
&EM_NUM_ASSESS — resolves to the number of variables that have the model role of Assess.
-
&EM_NUM_CENSOR — resolves to the number of variables that have the model role of Censor.
-
&EM_NUM_CLASSIFICATION — resolves to the number of variables that have the model role of Classification.
-
&EM_NUM_COST — resolves to the number of variables that have the model role of Cost.
-
&EM_NUM_CROSSID — resolves to the number of variables that have the model role of Cross ID.
-
&EM_NUM_DECISION — resolves to the number of variables that have the model role of Decision.
-
&EM_NUM_FREQ — resolves to the number of variables that have the model role of Freq.
-
&EM_NUM_ID — resolves to the number of variables that have the model role of ID.
-
&EM_NUM_LABEL — resolves to the number of variables that have the model role of Label.
-
&EM_NUM_PREDICT — resolves to the number of variables that have the model role of Predict.
-
&EM_NUM_REFERRER — resolves to the number of variables that have the model role of Referrer.
-
&EM_NUM_REJECTS — resolves to the number of variables that have the model role of Rejected.
-
&EM_NUM_REPORT_VAR — resolves to the number of variables that have the model role of Report.
-
&EM_NUM_CLASS_REPORT — resolves to the number of class variables that have the model role of Report.
-
&EM_NUM_INTERVAL_REPORT — resolves to the number of interval variables that have the model role of Report.
-
&EM_NUM_RESIDUAL — resolves to the number of variables that have the model role of Residual.
-
&EM_NUM_SEGMENT — resolves to the number of variables that have the model role of Segment.
-
&EM_NUM_SEQUENCE — resolves to the number of variables that have the model role of Sequence.
-
&EM_NUM_TEXT — resolves to the number of variables that have the model role of Text.
-
&EM_NUM_TIMEID — resolves to the number of variables that have the model role of Time ID.
Statements
Statements macro variables
resolve to values that refer to information about decision variables
and decision information. These macro variables are empty when there
is more than one target variable.
-
&EM_DEC_TARGET — resolves to the name of the target variable.
-
&EM_DEC_LEVEL — resolves to the event level.
-
&EM_DEC_ORDER — resolves to the sorting order of the target levels (ASCENDING | DESCENDING).
-
&EM_DEC_FORMAT — resolves to the format of the decision target variable.
-
&EM_DEC_DECMETA — resolves to the decision metadata data set of the target variable.
-
&EM_DEC_DECDATA — resolves to the decision data set of the target variable.
-
&EM_DEC_STATEMENT — resolves to the decision statement.
Code Statements
Use the Code Statements
macro variable to identify the file containing the CODE statement.
-
&EM_STATEMENT_RESCODE — resolves to the file containing a CODE statement with a residuals option. In effect, this will resolve to the file containing FLOW scoring code (&EM_FILE_EMFLOWSCORECODE).
-
&EM_STATEMENT_CODE — resolves to the file for containing a CODE statement does not have a residuals option. In effect, this will resolve to the file containing PUBLISH scoring code (&EM_FILE_EMPUBLISHSCORECODE).
Code Pane
The code pane is where
you write new SAS code or where you import existing code from an external
source. Any valid SAS language program statement is valid for use
in the SAS Code node with the exception that you cannot issue statements
that generate a SAS windowing environment. The SAS windowing environment
from Base SAS is not compatible with SAS Enterprise Miner. For example,
you cannot execute SAS Lab from within a SAS Enterprise Miner SAS
Code node.
The code pane has three
views: Training Code, Score Code, and Report Code. You can use either
the icons on the toolbar or the View menu to select the editor in
which you want to work.
When you enter SAS code
in the code pane, DATA steps and PROC steps are presented as collapsible
or expandable blocks of code. The code pane itself can be expanded
or contracted using the icons located at the bottom left-side of the pane.
icons located at the bottom left-side of the pane.
You can drag and drop
macros and macro variables from their respective tables into the code
pane. This speeds up the coding process and prevents spelling errors.
You can import SAS code that is stored as a text file or a source
entry in a SAS catalog. If your code is in an external text file,
then follow this example:
filename fref "path-name\mycode.sas";
%inc fref;
filename fref;
If your code is in a
catalog, follow this example:
filename fref catalog "libref.mycatalog.myentry.source";
%inc fref;
filename fref;
The code in the three
views is executed sequentially at when the node is run. Training code
is executed first, followed by Score code, and finally, Report code.
Suppose, for example, that you make changes to your Report code but
do not change your Training and Score code. When you run your node
from within the Code Editor, SAS Enterprise Miner does not have to
rerun the Training and Score code; it just reruns the Report code.
This can save considerable time if you have complex code or very large
data sets.
The three views are
designed to be used in the following manner:
-
Training Code — Write code that passes over the input training or transaction data to produce some result in the Training Code pane. For example:
proc means data=&em_import_data;
output out=m;
run;
You should also write dynamic scoring code in the training code pane. Scoring code is code that generates new variables or transforms existing variables. Dynamic scoring code, as opposed to static scoring code, is written such that no prior knowledge of the properties of any particular data set is assumed. That is, the code is not unique to a particular process flow diagram. For example, suppose that you begin your process flow diagram with a particular data source and it is followed by a SAS Code node that contains dynamic scoring code. If you changed the data source in the diagram, the dynamic scoring code should still execute properly. Dynamic scoring code can make use of SAS PROC statements and macros, whereas static scoring code cannot. -
Score Code — Write code that modifies the train, validate, test, or transaction data sets for the successor nodes. The Score view is, however, reserved for static scoring code. Static scoring code makes references to properties of a specific data set, such as variable names, so the code is unique for a particular process flow diagram. For example,
logage= log(age);
If you write dynamic scoring code in the Score Code pane, it will not execute. Scoring code that is included in the Score Code pane must be in the form of pure DATA steps. SAS PROC statements and macros will not execute in the Score Code pane. -
Report Code — code that generates output that is displayed to the user. The output can be in the form of graphs, tables, or the output from SAS procedures. For example, statements such as
proc print data=m;
run;
Calls to the macro %EM_REPORT, which are illustrated in Examples Using %EM_REPORT, are the most common form of Report code.
You can execute your
code in two modes.
-
Run Code () — Code will be executed immediately in the
current SAS session. Only the code in the active code pane is executed.
The log and output will appear in the Code Editor's Results pane.
If a block of code is highlighted, only that code is executed. No
pre-processing or post-processing will occur. Use this mode to test
and debug blocks of code during development.
-
Run Node () — The code node and all predecessor nodes
will be executed in a separate SAS session, exactly as if the user
has closed the editor and run the path. All normal pre-processing
and post-processing will occur. Use the Results window
to view the log, output, and other results generated by your code.
Most nodes generate
permanent data sets and files. However, before you can reference a
file in your code, you must first register a unique file key using
the %EM_REGISTER macro and then associate a file with that key. When
you register a key, SAS Enterprise Miner generates a macro variable
named &EM_USER_key. You use that macro variable in your code
to associate the file with the key. Registering a file allows SAS
Enterprise Miner to track the state of the file and avoid name conflicts.
Use the %EM_GETNAME
macro to reinitialize the macro variable &EM_USER_key when referring
to a file's key in a code pane other than the one in which it was
registered. Using Run Code causes the code in the active code pane
to execute in a separate SAS session. If the key was registered in
a different pane, &EM_USER_key will not be initialized. The registered
information is stored on the server, so you don't have to register
the key again, but you must reinitialize &EM_USER_key.
SAS Code Node Results
To view the SAS Code
node's Results window from within the Code
Editor, click the icon. Alternatively, you can view the Results window
from the main SAS Enterprise Miner workspace by right-clicking the
SAS Code node in the diagram and selecting Results.
For general information about the Results window,
see Using the Results Window in the SAS Enterprise Miner Help.
icon. Alternatively, you can view the Results window
from the main SAS Enterprise Miner workspace by right-clicking the
SAS Code node in the diagram and selecting Results.
For general information about the Results window,
see Using the Results Window in the SAS Enterprise Miner Help.
Select View from
the main menu in the Results window to view
the following results:
-
Properties
-
Settings — displays a window with a read-only table of the SAS Code node's properties configuration when the node was last run.
-
Run Status — displays the status of the SAS Code node run. The Run Start Time, Run Duration, and information about whether the run completed successfully are displayed in this window.
-
Variables — display a table of the variables in the training data set.
-
Train Code — displays the code that SAS Enterprise Miner used to train the node.
-
Notes — displays (in Read-Only mode) any notes that were previously entered in the Notes editor.
-
-
SAS Results
-
Log — the SAS log of the SAS Code node's run.
-
Output — The SAS Code node's output report, like all other nodes, includes Training Output, Score Output, and Report Output. The specific contents are determined by the results of the code that you write in the SAS Code node.
-
Flow Code — the SAS code used to produce the output that the SAS Code node passes on to the next node in the process flow diagram.
-
Train Graphs — displays graphs that are generated by SAS\GRAPH commands from within the Train code pane.
-
Report Graphs — displays graphs that are generated by SAS\GRAPH commands from within the Report code pane.
-
-
Scoring
-
SAS Code — the SAS score code that was created by the node. The SAS score code can be used outside of the SAS Enterprise Miner environment in custom user applications.
-
PMML Code — the SAS Code node does not generate PMML.
-
-
Assessment — this item appears only if the Tool Type property is set to MODEL. By default, it contains a submenu item for Fit Statistics. You can, however, generate other items by including the appropriate type code in the node.
-
Custom Reports — appears as an item in the menu when you generate custom reports using %EM_REPORT. The title in the menu, by default, is Custom Reports, but that can be changed by specifying the BLOCK argument of the macro %EM_REPORT.
-
Table — displays a table that contains the underlying data that is used to produce a chart.
-
Plot — use the Graph wizard to modify an existing Results plot or create a Results plot of your own.
SAS Code Node Examples
Example 1A: Writing New SAS Code
Follow these steps to
write SAS code to compare the distributions of interval variables
in the training and validation data sets.
-
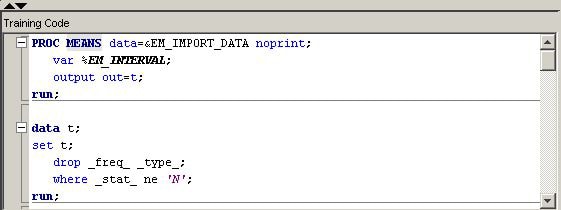
/* perform PROC MEANS on interval variables in training data */
/* output the results to data set named t                    */

proc means data=&em_import_data noprint;
   var %em_interval;
   output out=t;
run;

/* drop unneeded variables and observations  */

data t;
set t;
   drop _freq_ _type_;
   where _stat_ ne 'N';
run;

/* transpose the data set  */

proc transpose data=t out=tt;
     id _stat_;
run;

/* add a variable to identify data partition */

data tt;
set tt;
   length datarole $8;
   datarole='train';
run;

/* perform PROC MEANS on interval variables in validation data */
/* output the results to data set named v                    */

proc means data=&em_import_validate noprint;
     var %em_interval;
     output out=v;
run;

/* drop unneeded variables and observations  */

data v;
set v;
   drop _freq_ _type_;
   where _stat_ ne 'N';
run;

/* transpose the data set  */

proc transpose data=v out=tv;
   id _stat_;
run;

/* add a variable to identify data partition */

data tv;
set tv;
   length datarole $8;
   datarole='valid';
run;

/* append the validation data results */
/* to the training data results       */

proc append base=tt data=tv;
run;

/* register the key Comp and      */
/* create a permanent data set so */
/* that the data set can be used  */
/* later in Report code           */

%em_register(key=Comp, type=data);

data &em_user_Comp;
  length _name_ $12;
  label _name_ = 'Name';
  set tt;
  cv=std/mean;
run;

/* tabulate the results */

proc tabulate data=&em_user_Comp;
   class _name_ datarole;
   var min mean max std vc;
   table _name_*datarole, min mean max std cv;
   keylabel sum=' ';
   title 'Distribution Comparison';
run;

Example 1B: Adding Logical Evaluation
The SAS code in Example
1A generates error messages if no validation data set exists. You
use conditional logic within a macro to make the program more robust.
To do so, follow these steps.
-
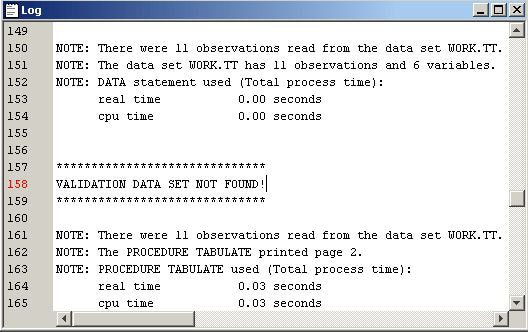
Add the following code shown in blue in the Training Code pane. The %EVAL function evaluates logical expressions and returns a value of either 1(for true) or 0 (for false). In this example, it checks whether a value has been assigned to the macro variable &EM_IMPORT_VALIDATE . If a validation data set exists, &EM_IMPORT_VALIDATE will be assigned a value of the name of the validation data set, and the macro variable, &cv, is set to 1. The new code checks the existence of a validation data set before it calculates the values of minimum, mean, max, and standard deviation of variables. If no validation data set exists, it writes a note to the Log window.
%macro intcompare();
   %let cv=0;
   %if "em_import_validate" ne "" and
       (%sysfunc(exist(&em_import_validate)) or
        %sysfunc(exist(&em_import_validate, VIEW))) %then
        %let cv=1;

   proc means data=&em_import_data noprint;
      var %em_interval;
      output out=t;
   run;

   data t;
      set t;
      drop _freq_ _type_;
      where _stat_ ne 'N';
   run;

   proc transpose data=t out=tt;
      id _stat_;
   run;

   data tt;
      set tt;
      length datarole $8;
      datarole='train';
   run;

   %if &cv %then %do;

      proc means data=&em_import_validate noprint;
         var %em_interval;
         output out=v;
      run;

      data v;
         set v;
         drop _freq_ _type_;
         where _stat_ ne 'N';
      run;

      proc transpose data=v out=tv;
         id _stat_;
      run;

      data tv;
         set tv;
         length datarole $8;
         datarole='valid';
      run;

      proc append base=tt data=tv;
      run;

      %em_register(key=Comp, type=data);

      data &em_user_Comp;
         length _name_ $12;
         label _name_ = 'Name';
         set tt;
         cv=std/mean;
      run;

   %end;

   %else %do;

      %put &em_codebar;
      %put %str(VALIDATION DATA SET NOT FOUND!);
      %put &em_codebar;

   %end;

   proc tabulate data=&em_user_Comp;
      class _name_ datarole;
      var min mean max std cv;
      table _name_*datarole, min mean max std cv;
      keylabel sum=' ';
      title 'Distribution Comparison';
   run;

%mend intcompare;
%intcompare();
Example 1C: Adding Report Elements
In parts 1A and 1B,
the comparison of variables distributions is displayed in the Output window.
In addition, you might also want to include the tabulated comparison
in a SAS table view and to create a plot of some of the statistics.
To do so, follow the steps below.
-
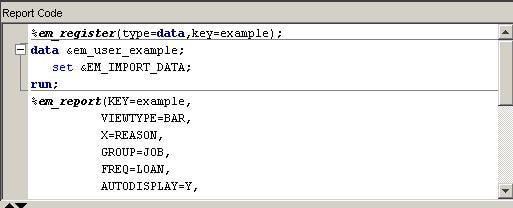
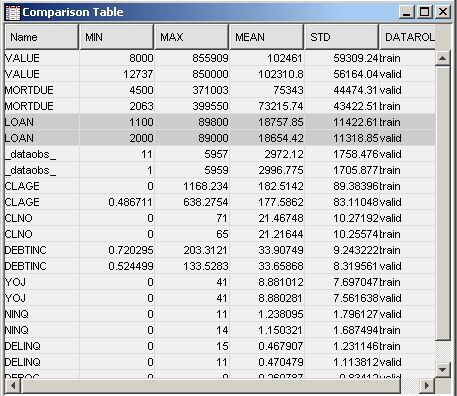
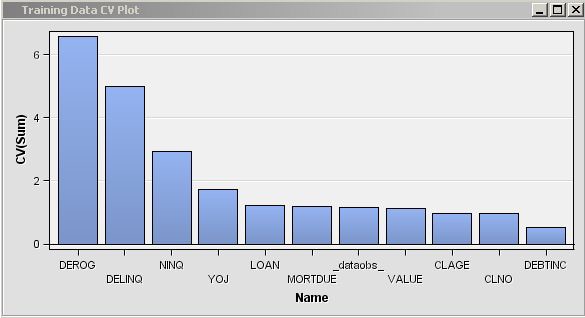
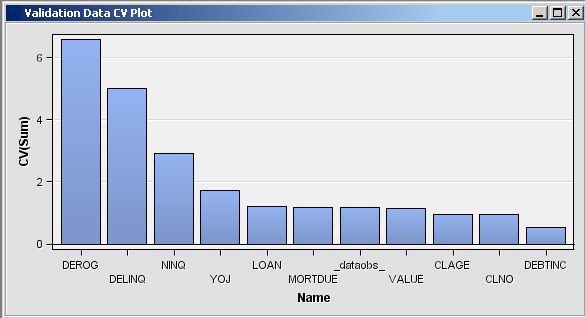
/* initialize the &em_user_Comp macro variable  */

%em_getname(key=Comp, type=data);

/*** Save Results with EM Name ***/

proc sort
data=&em_user_Comp
out=&em_user_Comp;
	by descending cv;
run;

/*** Add to EM Results ***/

%em_report(key=Comp,
	   viewtype=Data,
	   block=Compare,
	   description=Comparison Table);

%em_report(key=Comp,
	   viewtype=Bar,
	   x=_name_,
	   freq=cv,
	   block=Compare,
	   where= datarole eq 'train',
	   autodisplay=Y,
	   description=Training Data CV Plot);

%em_report(key=Comp,
	   viewtype=Bar,
	   x=_name_,
	   freq=cv,
	   block=Compare,
	   where= datarole eq 'valid',
	   autodisplay=Y,
	   description=Validation Data CV Plot);

run;
-
In the Results window, select View
 CompareTraining Data CV Plot from the main menu. The following Training
Data CV Plot window appears. The plot displays a bar
chart of the coefficient of variation for each variable in the training
data set.
In the Results window, select ViewCompareValidation Data CV Plot from
the main menu. The following Validation Data CV Plot window
appears. The plot displays a bar chart of the coefficient of variation
for each variable in the training data set.
CompareTraining Data CV Plot from the main menu. The following Training
Data CV Plot window appears. The plot displays a bar
chart of the coefficient of variation for each variable in the training
data set.
In the Results window, select ViewCompareValidation Data CV Plot from
the main menu. The following Validation Data CV Plot window
appears. The plot displays a bar chart of the coefficient of variation
for each variable in the training data set.
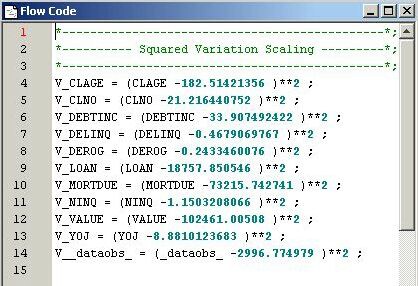
Example 1D: Adding Score Code
Suppose you want to
generate scoring code to rescale the variables to their deviation
from the mean. SAS Enterprise Miner recognizes two types of SAS scoring
code, Flow scoring code and Publish scoring code. Flow scoring code
is used to score SAS data tables inside the process flow diagram.
Publish scoring code is used to publish the SAS Enterprise Miner model
to a scoring system outside the process flow diagram. To generate
both types of scoring code, follow the steps below.
-
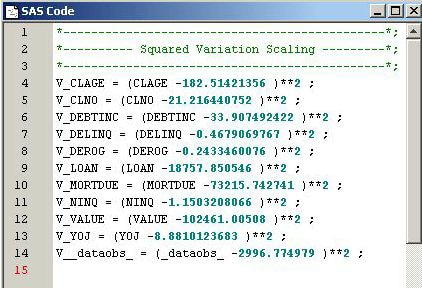
/* Add Score Code */

%macro scorecode(file);
data _null_;
   length var $32;
   filename X "&file";
   FILE X;
   set &em_user_Comp(where=(datarole eq 'train'));

if _N_ eq 1 then do;
   put '*----------------------------------------------*;';
   put '*---------- Squared Variation Scaling ---------*;';
   put '*----------------------------------------------*;';
end;

var=strip('V_' !! _name_);
put var '= (' _name_ '-' mean ')**2 ;' ;
run;

%mend scorecode;
%scorecode(&em_file_emflowscorecode);
%scorecode(&em_file_empublishscorecode);
Example 1E: Modifying Variables Metadata
New variables have been
added to the model and the original variables need to be removed to
avoid duplicating terms in the final model. The variables can be dropped
from the incoming tables or they can be given a Role of REJECTED in
the exported metadata. You follow these steps to generate SAS code
to modify the exported metadata tables. SAS code is used to create
rules that can have more than one condition. Even though the training,
validation, and test data sets are processed in the flow, you need
to modify only the metadata for the exported training data set. You
modify the metadata for the validation and test data sets only when
different variables are created on the validation or test data set.
-
/* Modify Exported Training Metadata */ data _null_; length string $34; filename X "&em_file_cdelta_train"; FILE X; set &em_user_Comp( where=(datarole eq 'train')); /* Reject Original Variable */ string = upcase('"'!!strip(_NAME_)!!'"'); put 'if upcase(NAME) eq ' string ' then role="REJECTED" ;' ; /* Modify New Variables */ var=upcase(strip('V_' !! _name_ )); string = '"'!!strip(var)!!'"'; put 'if upcase(NAME) eq ' string ' then do ;' ; put ' role="INPUT" ;' ; put ' level= "INTERVAL" ;' ; put ' comment= "Squared Variation" ;' ; put 'end ;' ; run; -
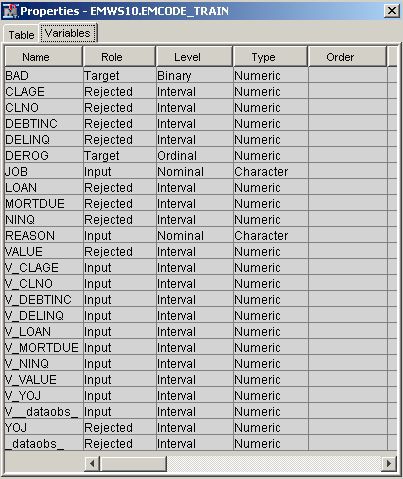
Select the Train data set from the Port column of the table. Click the Properties button at the bottom of the window.Click the Variables tab.The original interval input variables now have a Role of REJECTED. The new variables (V_xxx) have a Role of INPUT.
Example 2: Writing SAS Code to Create Predictive Models
This example shows you
additional features of the SAS Code node.
-
/* Register User Files */ %em_register( key=Fit, type=Data); %em_register( key=Est, type=Data); /* Training Regression Model */ /* Create a DMDB database */ %em_dmdb(out=1); /* Fit logistic regression model */ /* using macro %em_dmreg from the */ /* sashelp.emutil catalog */ %em_dmreg( selection=Stepwise, outest=&em_user_Est, outselect=Work.Outselect); /* Work.Outselect contains the names of REJECTED variables */ /* &em_user_Est contains parameter estimates and t statistics */ /* for each of the stepwise models */ /* Modify Exported Metadata */ data _null_; length string $34; filename X "&em_file_cdelta_train"; FILE X; if _N_=1 then do; put "if ROLE in ('INPUT','REJECTED') then do;"; put "if NAME in ("; end; set Work.Outselect end=eof; string = '"'!!trim(left(TERM))!!'"'; put string; if eof then do; put ') then role="INPUT";'; put 'else role="REJECTED";'; put 'end;'; end; run; -
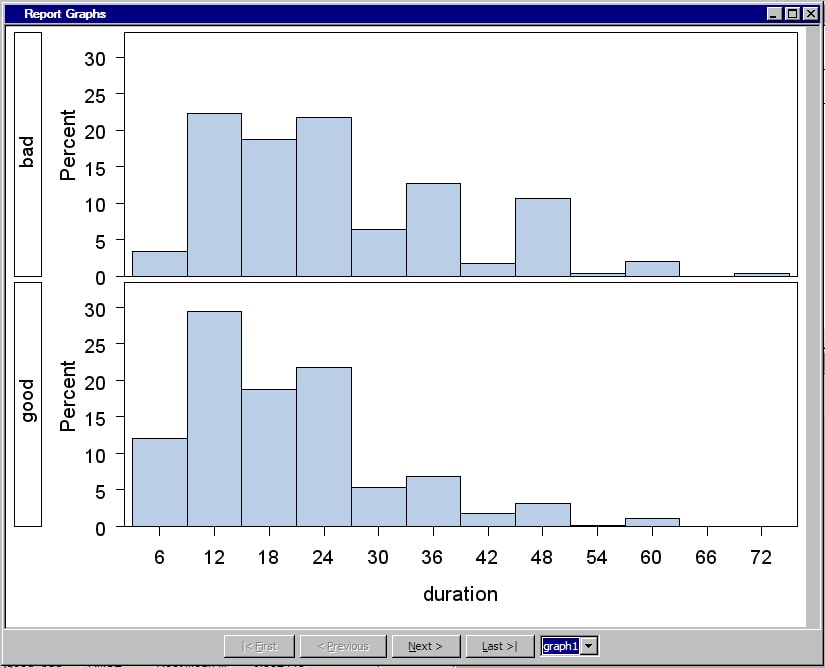
/* Generate Graphs */

proc univariate data=&em_import_data noprint;
     class &em_dec_target;
     histogram %em_interval_input;
run;
SAS graphs are automatically copied from the WORK.GSEG catalog and GIF files are created and stored in the node's REPORTGRAPH subfolder. For example, suppose your projects are stored in a folder namedC:\EMPROJECTS. If your project name is SASCODE and your diagram ID is EMWS1, the GIF files are stored inC:\EMPROJECTS\SASCODE\WORKSPACES\EMWS1\EMCODE\REPORTGRAPH. -
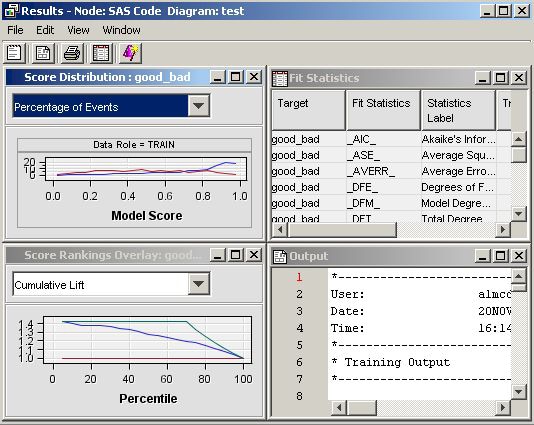
Run the SAS Code node and view the results. Open the Score Distribution chart. The following display shows an example of the SAS Code results window.Standard results of a model node are displayed. The SAS Code is registered as a MODEL tool at the beginning of the SAS code. Therefore, fit statistics, and plots of score distribution and score rankings are automatically displayed. Select ViewSAS
ResultsReport Graphs from
the main menu. The Report Graphs window appears
and displays the output from the PROC UNIVARIATE statement. The PROC
UNIVARIATE statement produces histograms of each input interval input
for both target levels.
-
Open the Code Editor for the newly added SAS Code node and copy the following code in the Training Code editor. The code is similar to that in step 6, but uses PROC ARBOR to create a decision tree model. The PROC ARBOR step is encapsulated in the %EM_ARBOR macro.
/* Registering User Files */ %em_register(key=MODEL, type=DATA); %em_register(key=IMPORTANCE, type=DATA); %em_register(key=NODES, type=DATA); %em_register(key=LEAFSTATS, type=DATA); /* Training Decision Tree Model */ %em_arbor( criterion=probchisq, alpha=0.2, outmodel=&EM_USER_MODEL, outimport=&EM_USER_IMPORTANCE, outnodes=&EM_USER_NODES); /**************************************************************************/ /* CRITERION = criterion (VARIANCE, PROBF, ENTROPY, GINI, PROBCHISQ) */ /* ALPHA = alpha value; used with criterion = PROBCHISQ or PROBF */ /* (default=0.20) */ /* OUTMODEL = tree data set; encode info used in the INMODEL option */ /* OUTIMPORT = importance data set; contains variable importance */ /* OUTNODES = nodes data set; contains node information */ /**************************************************************************/ /* Modifying Exported Metadata */ data _null_; length string $200; filename X "&EM_FILE_CDELTA_TRAIN"; file X; set &EM_USER_IMPORTANCE end=eof; if IMPORTANCE =0 then do; string = 'if NAME="'!!trim(left(name))!!'" then do;'; put string; put 'ROLE="REJECTED";'; string = 'COMMENT="'!!"&EM_NODEID"!!':Rejected because of low importance value";'; put string; put 'end;'; end; else do; string = 'if NAME="'!!trim(left(name))!!'" then ROLE="INPUT";'; put string; end; if ^eof then put 'else'; run; -
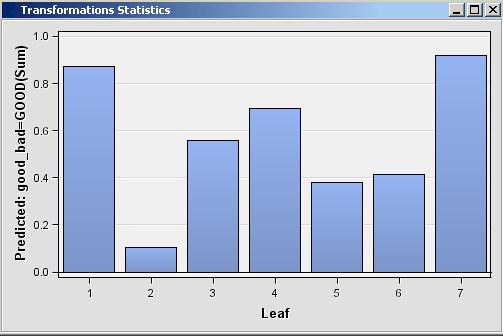
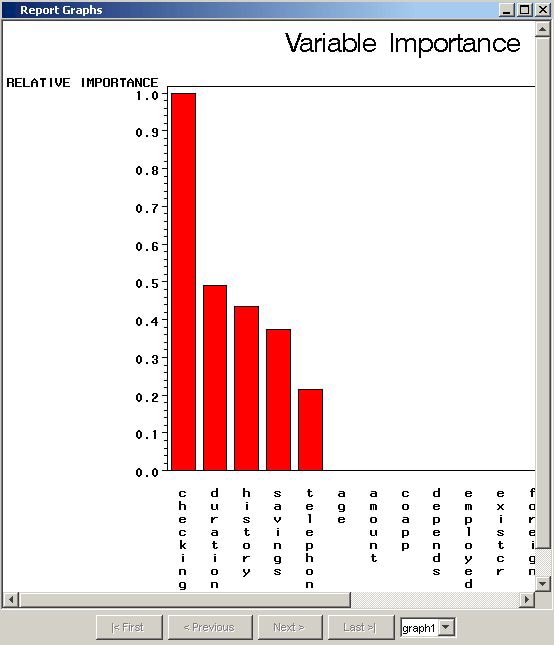
/* Generating Reports */

/* Initialize &EM_PRED with the name of the */
/* target=1 prediction variable             */

data _null_;
   set &em_dec_decmeta;
   where _TYPE_ eq "PREDICTED" AND LEVEL eq "GOOD";
   call symput("EM_PRED",VARIABLE);
run;

/* Reinitialize registered keys  */

%em_getname(key=LEAFSTATS, type=data);
%em_getname(key=NODES, type=data);
%em_getname(key=IMPORTANCE, type=data);

/* retrieve the predicted variables data set */

data &EM_USER_LEAFSTATS;
   set &EM_USER_NODES(
   keep=LEAF N NPRIORS P_: I_: U_:);
   where LEAF ne .;
   format LEAF 3.;
run;

/* plot the target prediction for each leaf */

%EM_REPORT(key=LEAFSTATS,
           description=STATISTICS,
           viewtype=BAR,
           freq=&EM_PRED,
           x=LEAF);

/* Generating Graphs */

%em_getname(key=IMPORTANCE, type=data);

/* Plot the Importance of the Individual Variables */

proc gchart data=&EM_USER_IMPORTANCE;
     vbar name/sumvar=importance discrete descending;
     title 'Variable Importance';
run;
title;
quit;
Examples Using %EM_REPORT
Bar Charts
This example demonstrates
how to generate a simple bar chart and progressively add features.
-
Click Results (). When the Results window
appears, double click the title bar of the bar chart pane and you
should see the following:
Examining the code that was submitted, the first line is:
%em_register(type=Data, key=Example);
The macro %EM_REGISTER registers the data key "Example". The three lines,data &em_user_Example; set &em_import_Data; run;
performs a SAS DATA step. By using the macro variable &em_user_Example for the data set name, the data set name is linked to the data key that was registered previously. So the general form of this macro variable is &em_user_<key>, where <key> is the argument that you supplied to %EM_REGISTER. The macro variable &EM_IMPORT_DATA used in the set statement resolves to the data set that is imported from the Home Equity data node that precedes the SAS Code node in the path. Finally, analyze the arguments that were supplied to the macro %EM_REPORT:%em_report( key=Example, viewtype=Bar, x=Reason, autodisplay=Y, description=%bquote(Simple Bar Chart), block=%bquote(My Graphs));
Six arguments were specified.The 1st argument, KEY=Example, links the graph to the data set via the key that was registered previously using %EM_REGISTER; it is a required argument for %EM_REPORT.The 2nd argument, VIEWTYPE=Bar, specifies that a bar chart is the desired type of graph.The 3rd argument, X=Reason, specifies that the variable REASON is to populate the x-axis. By default, the y-axis is the frequency of the variable populating the x-axis, but as will be demonstrated later, this feature of the graph can be changed using the FREQ argument. The variable, Reason, records the reported purpose for the applicant's home equity loan.The 4th argument, AUTODISPLAY=Y, specifies to automatically display the graph in the Results window. Without this option, you would have to use the Results window's View menu to display the graph.The 5th argument, DESCRIPTION=%bquote(Simple Bar Chart), specifies the text that is to appear in the title bar of the graph pane. The description is also used to populate a View submenu. By default, the View menu lists an item, known as a block, called Custom Reports. The description is listed in the block's submenu. By including the final option, BLOCK=%bquote(My Graphs), the block will be labeled "My Graphs" rather than "Custom Reports" and the Description, "Simple Bar Chart" will appear as a menu item under My Graphs.Our data set includes a variable, JOB, which records the profession of the loan applicant. Suppose you want to see how the frequencies for REASON are distributed across JOB. You can do this by specifying the GROUP option of %EM_REPORT. So, replace the call to %EM_REPORT in your code with the following:%em_report( key=Example, viewtype=Bar, x=Reason, group=Job, autodisplay=Y, description=%bquote(REASON grouped by JOB), block=%bquote(My Graphs));
Save your modified code, click Run Node (), and then click Results ( ). You new graph should look like this:
There is a variable in our data set called LOAN that records the dollar amount of the requested loan. Suppose now that instead of displaying the number of loans by type, you want to display the dollar amounts, still grouping by JOB. To do this, add the FREQ argument to %EM_REPORT. Replace the call to %EM_REPORT with the following:%em_report( key=example, viewtype=Bar, x=Reason, group=Job, freq=Loan, autodisplay=Y, description=%bquote(REASON grouped by JOB weighted by LOAN), block=%bquote(My Graphs));
Save your modified code, click Run Node (), and then click Results (). You new graph should look like this:
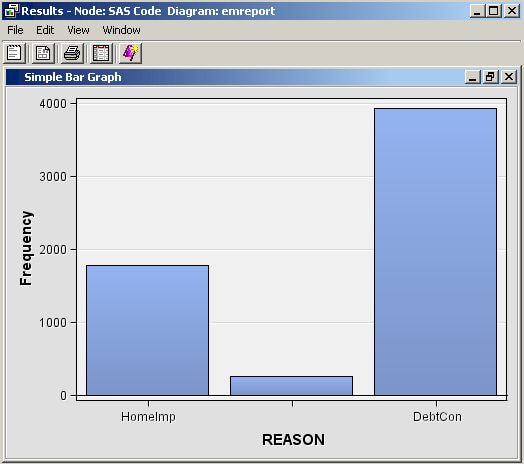
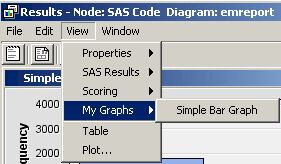
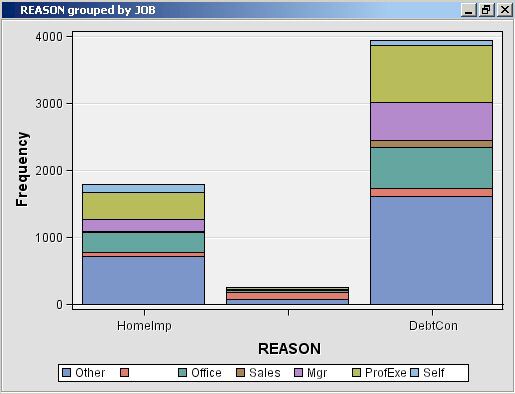
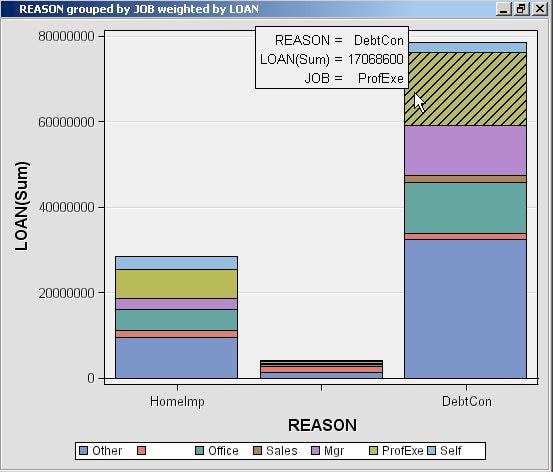
Multiple Bar Charts
The previous example,
Bar Charts, demonstrated how to generate a single bar chart using
%EM_REPORT. Specifically, using the Home Equity data set, a bar chart
was generated for the variable REASON, grouped by JOB, and weighted
by LOAN. This example extends that example by demonstrating how to
generate a combo box that enables you to view different frames of
a plot. The example starts where the previous example finished and
adds two additional plots; a different weight variable is used for
each frame of the plot. This is accomplished by including the VIEW
argument of %EM_REPORT to specify an ID value in multiple calls to
%EM_REPORT. The CHOICETEXT argument is also used, enabling you to
attach text to each frame that is displayed by the combo box.
-
%em_register(type=Data, key=Example);
data &em_user_Example;
set &em_import_data;
run;

%em_report(
   key=Example,
   viewtype=Bar,
   view=1,
   x=Reason,
   group=Job,
   freq=Loan,
   choicetext=Loan,
   autodisplay=Y,
   description=%bquote(Reason by Job with Weights),
   block=%bquote(My Graphs));

%em_report(
   view=1,
   freq=Value,
   choicetext=Value);

%em_report(
   view=1,
   freq=Mortdue,
   choicetext=Mortdue);
Each call to %EM_REPORT defines a different frame for the graph. There are three things that you should notice about the second and third calls to %EM_REPORT. The first is that you must specify the VIEW argument with the same ID number in all three calls to %EM_REPORT. This links the three calls. The second is that except for the VIEW argument, the only other arguments that you need to specify are the ones that have values that differ from the first call to %EM_REPORT. The third is that while arguments can have different values across the multiple calls to %EM_REPORT, you cannot specify different sets of arguments.
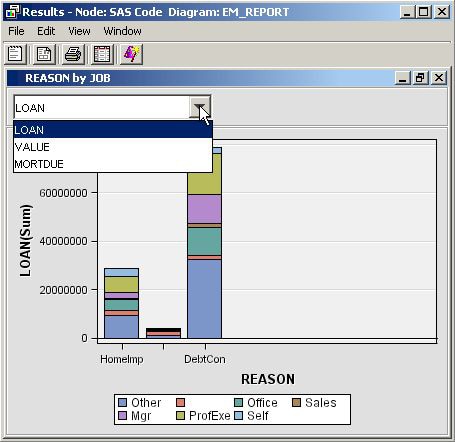
There is no pre-defined
limit on the number of frames that you can have. However, as the number
of frames grows large, the utility of the combo box declines.
Multiple Y Plot
This example demonstrates
how to use the macro %EM_REPORT to generate a line plot with two variables
on the y-axis. The technique demonstrated previously, in the example Multiple Bar Charts, for generating multiple frames will also be applied.
-
%em_register(type=Data, key=Sample); /* Simulate the data */ data &em_user_Sample; do X=1 to 100; var1 = 10 + ranuni(1234)*2; var2 = 10 + rannor(1234)*2; var3 = 10 + rannor(1234)*2.5; output; end; run ; %em_report( key=Sample, viewtype=Lineplot, view=2, x=X, /* specify the x-axis variable */ y1=var1, /* specify the 1st y-axis variable */ y2=var2, /* specify the 2nd y-axis variable */ choicetext=FirstFrame, autodisplay=Y, description=%bquote(Line Plots), block=%bquote(My Graphs)); %em_report( view=2, y1=var2, y2=var3, choicetext=SecondFrame); -
Click Results (). When the Results window
appears, double click the title bar of the bar chart pane and you
should see the following:
Click the drop-down arrow and select SecondFrame:%EM_REPORT enables you to overlay up to 16 variables on the y-axis using the Y1=<variable name>, Y2=<variable name>, ... , Y16=<variable name> arguments.
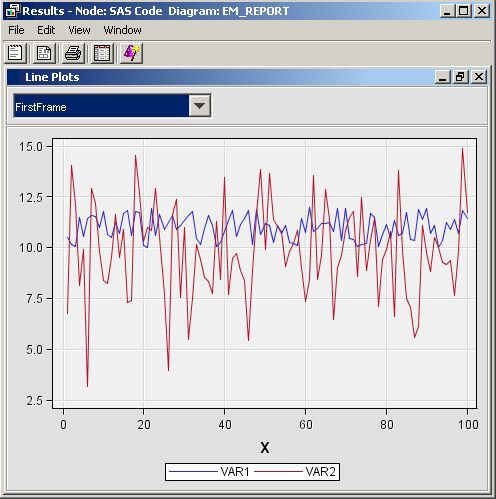
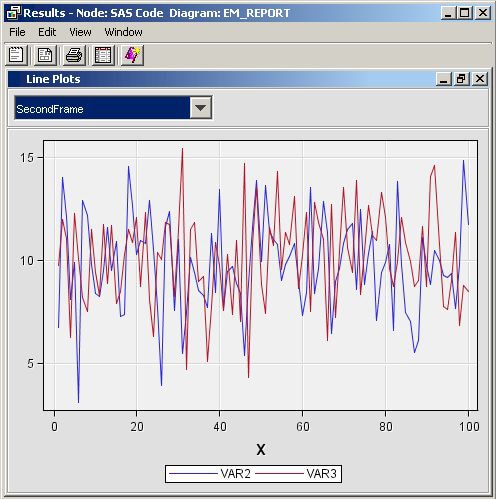
Dendogram
This example demonstrates
how to use the macro %EM_REPORT to generate a dendrogram.
-
%em_register(key=Outtree, type=Data);
%em_getname(key=Outtree, type=Data);
proc varclus data = &em_import_data hi outtree=&em_user_Outtree;
var Clage Clno Debtinc Delinq Derog Loan Mortdue Ninq Value Yoj;
run;
%em_report(
   key=OUTTREE,
   viewtype=DENDROGRAM,
   autodisplay=Y,
   block=Dendrogram,
   name=_Name_,
   parent=_Parent_,
   height=_Varexp_);
Note: The macro %EM_GETNAME used in the example code above returns a filename an initializes the macro variable &EM_USER_KEY, where KEY is the data key defined in the call to %EM_REGISTER.
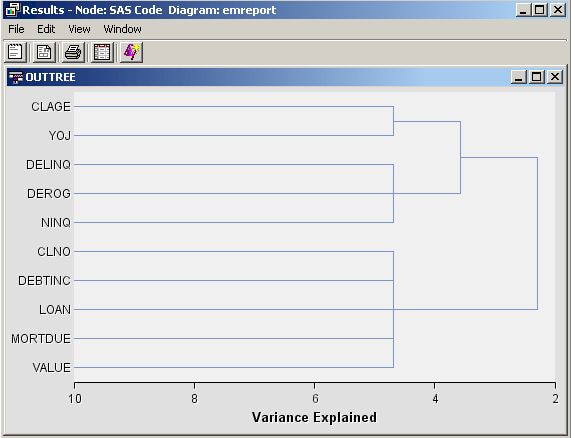
Three Dimensional Components
This example demonstrates
how to use %EM_REPORT to generate 3-dimensional scatter, bar, and
surface plots.
-
%em_register(key=Data, type=Data);

/* simulate data */

data One;
do i = 1 to 100;
   x= ranuni(0) * 100 * 200;
   y = ranuni(0) * 100 + 75;
   z = ranuni(0) * 100 + 10;
   output;
end;
run;

data &em_user_data;
  set Work.One;
run;

/* K-Dimensional Scatter Plot */

%em_report(
   key=Data,
   viewtype=ThreeDScatter,
   x=X,
   y=Y,
   z=Z,
   block=%bquote(My Graphs),
   description=%bquote(3DScatterPlot),
   autodisplay=Y);

/* K-Dimensional Surface Plot */

%em_report(
   key=Data,
   viewtype=Surface,
   x=X,
   y=Y,
   z=Z,
   block=%bquote(My Graphs),
   description=%bquote(Surface),
   autodisplay=Y);

%em_register(key=Class, type=Data);

data &em_user_Class;
  set Sashelp.Class;
run;

/* K-Dimensional Bar Chart */

%em_report(
   key=Class,
   viewtype=ThreeDBar,
   x=Name,
   y=Weight,
   series=Age,
   block=%bquote(My Graphs),
   description=%bquote(3DBar),
   autodisplay=Y);
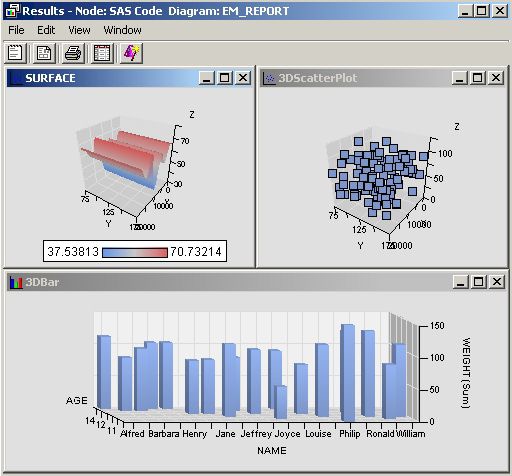
Simple Lattice of Plots
This example demonstrates
how to use %EM_REPORT to generate a simple lattice of plots. A lattice
of plots is a collection of plots displayed as a grid.
-
%em_register(type=Data, key=Example);
data &em_user_Example;
   set &em_import_data;
   where (Job='ProfExe' or Job='Mgr') and
         (Reason = 'DebtCon' or Reason = 'HomeImp');
run;
%em_report(
   key=Example,
   viewtype=Lattice,
   latticetype=Scatter,
   x=Debtinc,
   y=Mortdue,
   latticex=Job,
   latticey=Reason);
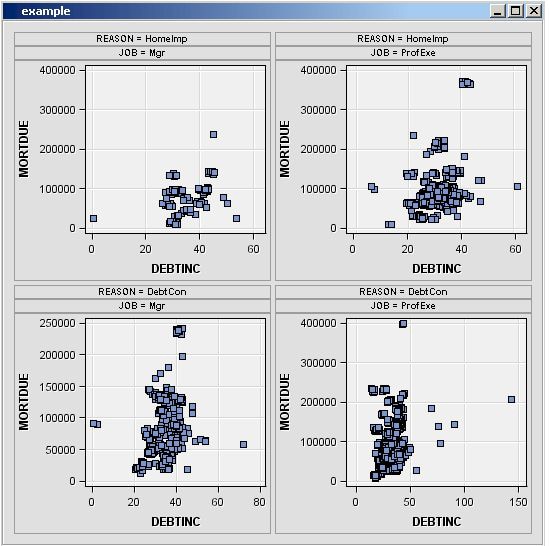
Constellation Plot
This example demonstrates
how to use %EM_REPORT to generate a Constellation plot.
-
%em_register(key=A, type=DATA);
%em_register(key=B, type=DATA);

data &em_user_a;
   set &em_lib..assoc_links;
run;

data &em_user_b;
   set &em_lib..assoc_nodes;
run;

%em_report(viewtype=Constellation,
           linkkey=A,
           nodekey=B,
           LINKFROM=FROM,
           LINKTO=TO,
           LINKID=linkid,
           LINKVALUE=CONF,
           nodeid=item,
           nodesize=count,
           nodetip=item);
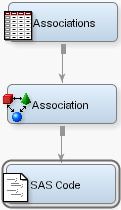
Importing Statistical Graphics with %EM_REPORT
The SAS Code node can
be used to display the results of PROC SGPLOT, or any other SG procedure.
What follows here is a pseudo-example that demonstrates the structure
required to import these graphics. The graphics are first exported
as a PDF by PROC SGPLOT and then imported using %EM_REPORT. To begin,
you need to enter the following code in the Report Code section
of the Code Editor. This is also illustrated
in the image below.
%em_register(key=REPORT, type=FILE, extension=pdf);
%em_report(KEY=REPORT, BLOCK=MODEL, VIEWTYPE = FILEVIEWER,
	autodisplay=Y, DESCRIPTION=My Custom Document);

ods pdf file="";
/* your sgplot code goes here */
ods pdf close;
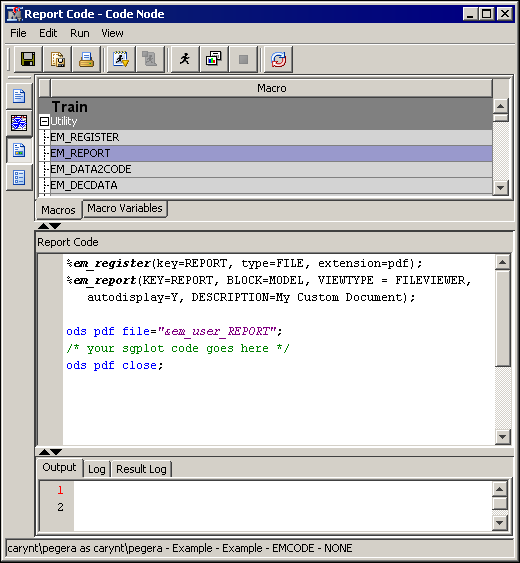
Notice the commented
portion
/* your sgplot code goes here */.
You need to insert your specific PROC SGPLOT code at that point in
the code.
This code creates a
window in the SAS Code node Results window
that enables you to open a PDF file that contains the results of the
SGPLOT procedure. The %EM_REGISTER macro creates a file reference
for the ODS file that is produced and is stored in the project’s
workspace for this code node. For example, this could be
C:\Project\test\Workspaces\EMWS7\EMCODE\report.pdf,
which maps to the project, workspace, code node ID, and file reference
for the PDF.
The %EM_REPORT macro
uses that file reference to populate a window in the SAS Code Node
results browser that displays a link to your report. The
ODS
                        PDF
statement uses a macro variable created by the %EM_REGISTER
macro called &EM_USER_REPORT to write the PDF file in the desired
location. Here, the term report in this macro
variable is the same as the KEY= value in the &EM_REGISTER macro
invocation.
Copyright © SAS Institute Inc. All rights reserved.