Generate Descriptive Statistics
To use the StatExplore
node to produce a statistical summary of the input data:
-
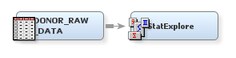
To connect the two nodes, position the mouse pointer over the right edge of the input data source node until the pointer becomes a pencil. With the left mouse button held down, drag the pencil to the left edge of the StatExplore node. Then, release the mouse button. An arrow between the two nodes indicates a successful connection.
-
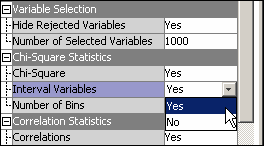
Select the StatExplore node. In the Properties Panel, scroll down to view the Chi-Square Statistics properties group. Click on the value of Interval Variables and select Yes from the drop-down menu that appears.Chi-square statistics are always computed for categorical variables. Changing the selection for interval variables causes SAS Enterprise Miner to distribute interval variables into five (by default) bins and compute chi-square statistics for the binned variables when you run the node.
-
In the Diagram Workspace, right-click the StatExplore node, and select Run from the resulting menu. Click Yes in the Confirmation window that opens.When you run a node, all of the nodes preceding it in the process flow are also run in order, beginning with the first node that has changed since the flow was last run. If no nodes other than the one that you select have changed since the last run, then only the node that you select is run. You can watch the icons in the process flow diagram to monitor the status of execution.
-
Nodes that are outlined in green are currently running.
-
Nodes that are denoted with a check mark inside a green circle have successfully run.
-
Nodes that are outlined in red have failed to run due to errors.
In this example, the DONOR_RAW_DATA input data node had not yet been run. Therefore, both nodes are run when you select to run the StatExplore node. -
-
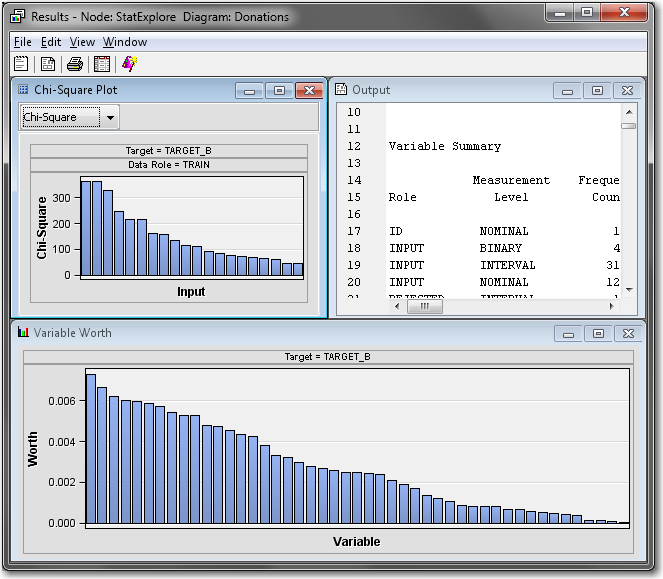
Note: Panels in Results windows might not have the same arrangement on your screen, due to window resizing. When the Results window is resized, SAS Enterprise Miner redistributes panels for optimal viewing.The results window displays the following:
-
a plot that orders the variables by their worth in predicting the target variable.Note: In the StatExplore node, SAS Enterprise Miner calculates variable worth using the Gini split worth statistic that would be generated by building a decision tree of depth 1. For detailed information about Gini split worth, see the SAS Enterprise Miner Help.
-
the SAS output from the node.
-
a plot that orders the top 20 variables by their chi-square statistics. You can also choose to view the top 20 variables ordered by their Cramer's V statistics on this plot.
TipIn SAS Enterprise Miner, you can select graphs, tables, and rows within tables and select Copy from the right-click pop-up menu to copy these items for subsequent pasting in other applications such as Microsoft Word and Microsoft Excel. -
-
Expand the Output window, and then scroll to the Class Variable Summary Statistics and the Interval Variable Summary Statistics sections of the output.
-
Notice that there are two class variables and two interval variables for which there are missing values. Later in the example, you will impute values to use in the place of missing values for these variables.
-
Notice that several variables have relatively large standard deviations. Later in the example, you will plot the data and explore transformations that can reduce the variances of these variables.
-
Copyright © SAS Institute Inc. All rights reserved.