Getting to Know the Graphical User Interface
You use the SAS Enterprise
Miner GUI to build a process flow diagram that controls your data mining project.
-
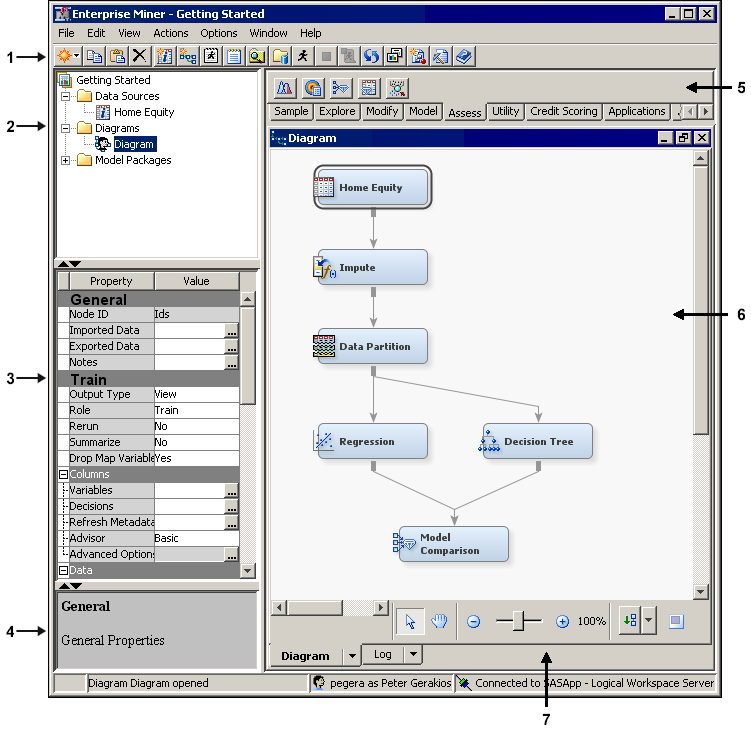
Toolbar Shortcut Buttons — Use the toolbar shortcut buttons to perform common computer functions and frequently used SAS Enterprise Miner operations. Move the mouse pointer over any shortcut button to see the text name. Click on a shortcut button to use it.
-
Project Panel — Use the Project Panel to manage and view data sources, diagrams, results, and project users.
-
Properties Panel — Use the Properties Panel to view and edit the settings of data sources, diagrams, nodes, and users.
-
Property Help Panel — The Property Help Panel displays a short description of any property that you select in the Properties Panel. Extended help can be found from the Help main menu.
-
Toolbar — The Toolbar is a graphic set of node icons that you use to build process flow diagrams in the Diagram Workspace. Drag a node icon into the Diagram Workspace to use it. The icon remains in place in the Toolbar, and the node in the Diagram Workspace is ready to be connected and configured for use in the process flow diagram.
-
Diagram Workspace — Use the Diagram Workspace to build, edit, run, and save process flow diagrams. In this workspace, you graphically build, order, sequence, and connect the nodes that you use to mine your data and generate reports.
-
Diagram Navigation Toolbar — Use the Diagram Navigation Toolbar to organize and navigate the process flow diagram.
Tip
The book “Predictive Modeling with SAS Enterprise Miner: Practical
Solutions for Business Applications”
provides examples of saving and exporting SAS code and offers additional
discussion about the SAS Enterprise Miner graphical user interface.
Copyright © SAS Institute Inc. All rights reserved.
