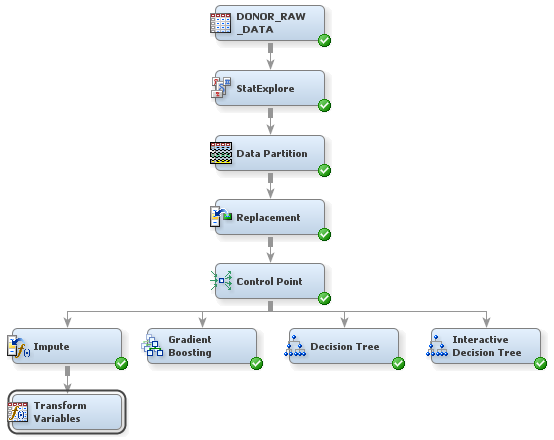
Transform Variables

Sometimes, input data is more informative on a scale other than that from which it was originally collected. For example, variable transformations can be used to stabilize variance, remove nonlinearity, improve additivity, and counter non-normality. Therefore, for many models, transformations of the input data (either dependent or independent variables) can lead to a better model fit. These transformations can be functions of either a single variable or of more than one variable.
To use the Transform Variables node to make variables better suited for logistic regression models and neural networks:
  1. From the Modify tab on the Toolbar, select the Transform Variables node icon. Drag the node into the Diagram Workspace.
  2. Connect the Impute node to the Transform Variables node.
    Transform Variables Process Flow Diagram
    Tip
    To align a process flow diagram vertically, as in the image above, right-click anywhere in the Diagram Workspace, and select Layoutthen selectVertically from the resulting menu.
  3. Select the Transform Variables node. In the Properties Panel, scroll down to view the Train properties, and click on the ellipses that represent the value of Formulas. The Formulas window appears.
    Formulas Window
    1. In the variables table, click the Role column heading to sort the variables in ascending order by their role.
    2. You can select any row in the variable table to display the histogram of a variable in the panel above. Look at the histograms for all variables that have the role Input. Notice that several variables have skewed distributions.
    3. Click OK to close the Formulas window.
  4. In the Properties Panel, scroll down to view the Train properties, and click on the ellipses that represent the value of Variables. The Variables — Trans window appears.
    1. The common log transformation is often used to control skewness. Select the transformation Method for the following interval variables and select Log 10 from the drop-down menu that appears:
      • FILE_AVG_GIFT
      • LAST_GIFT_AMT
      • LIFETIME_AVG_GIFT_AMT
      • LIFETIME_GIFT_AMOUNT
      Tip
      You can hold down the CTRL key to select multiple rows. Then, when you select a new Method for one of the selected variables, the new method will apply to all of the selected variables.
    2. Select the transformation Method for the following interval variables and select Optimal Binning from the drop-down menu that appears:
      • LIFETIME_CARD_PROM
      • LIFETIME_GIFT_COUNT
      • MEDIAN_HOME_VALUE
      • MEDIAN_HOUSEHOLD_INCOME
      • PER_CAPITA_INCOME
      • RECENT_RESPONSE_PROP
      • RECENT_STAR_STATUS
      The optimal binning transformation is useful when there is a nonlinear relationship between an input variable and the target. For more information about this transformation, see the SAS Enterprise Miner Help.
    3. Click OK.
  5. In the Diagram Workspace, right-click the Transform Variables node, and select Run from the resulting menu. Click Yes in the Confirmation window that opens.
  6. In the window that appears when processing completes, click OK.
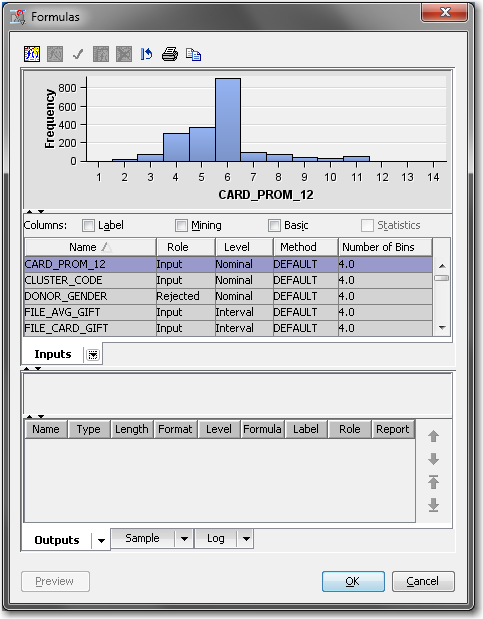
Note: In the data that is exported from the Transform Variables node, a new variable is created for each variable that is transformed. The original variable is not overwritten. Instead, the new variable has the same name as the original variable but is prefaced with an identifier of the transformation. For example, variables to which the log transformation have been applied are prefaced with LOG_, and variables to which the optimal binning transformation have been applied are prefaced with OPT_. The original version of each variable also exists in the exported data and has the role Rejected.