Association Analysis
Building the Process Flow Diagram
This example uses the
same diagram workspace that you created in Chapter 2. You have the
option to create a new diagram for this example, but instructions
to do so are not provided in this example. First, you need to add
the SAMPSIO.ASSOCS data source to project.
-
In the Data Source Wizard — Column Metadata window, make the following changes:
-
Note: The variable TIME identifies the sequence in which the products were purchased. In this example, all of the products were purchased at the same time, so the order relates only to the order in which they are scanned at the register. When order is taken into account, association analysis is known as sequence analysis. Sequence analysis is not demonstrated here.
Understanding Analysis Modes
To perform association
discovery, the input data set must have a separate observation for
each product purchased by each customer. You must assign the ID role
to one variable and the Target model role
to another variable when you create the data source.
To perform sequence
discovery, the input data set must have a separate observation for
each product purchased by each customer at each visit. In addition
to assignment of ID and Target roles,
your input data must contain a Sequence variable.
The sequence variable is used for timing comparisons. It can have
any numeric value including date/time values. The time or span from
observation to observation in the input data set must be on the same
scale.
Running the Association Node
In your diagram workspace,
right-click the Association node and click Run.
In the Confirmation window, click Yes.
Click Results in the Run Status window.
In the Results window,
select View Rules
Rules Rules Table from the main menu.
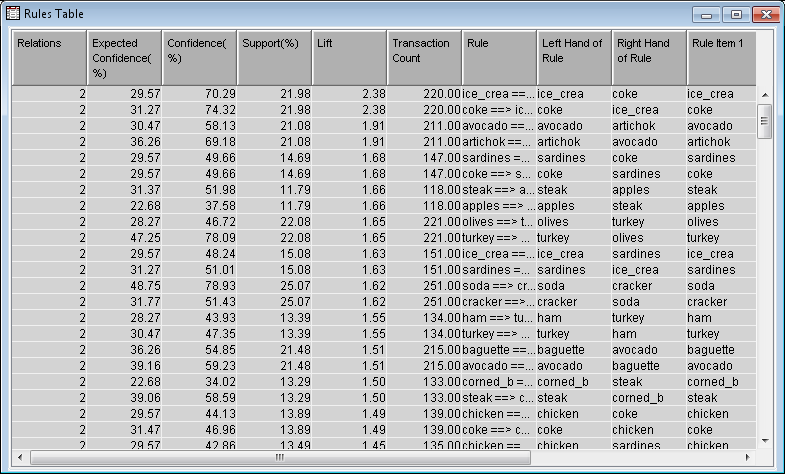
The Rules Table displays information about
each rule that was created. This includes the confidence, support,
lift, number of occurrences, and the items in the rule. To explain
confidence, support, and lift, consider the rule A => B where A
and B each represent one product.
Sort the Rules
Table by Support (%). Notice
that the top two rules are heineken ==> cracker and cracker
==> heineken, both with a support of 36.56%. This
indicates that 36.56% of all customers purchased beer and crackers
together.
The confidence for heineken
==> cracker is 61%, which indicates that 61% of customers
who purchased Heineken
then purchased crackers. For the rule cracker ==> heineken,
the confidence is 75%. This means that 75% of the customers who purchased
crackers then purchased Heineken.
Lift, in the context
of association rules, is the ratio of the confidence of a rule to
the expected confidence of the rule. The expected confidence is calculated
under the assumption that the left hand side of a rule is independent
from the right hand side of the rule. Consequently, lift is a measure
of association between the left hand side and right hand side of the
rule. Values that are greater than one represent positive association
between the left and right hand sides. Values that are equal to one
represent independence. Values that are less than one represent negative
association between the left and right hand sides.
Copyright © SAS Institute Inc. All rights reserved.

