Examining Web Log Data
Building the Process Flow Diagram
This example uses the
same diagram workspace that you created in Chapter 2. You have the
option to create a new diagram for this example, but instructions
to do so are not provided in this example. First, you need to add
the SAMPSIO.WEBPATH data source to project.
In the Project Panel,
drag the WEBPATH data source to your diagram
workspace. From the Explore tab, drag a Link
Analysis node to your diagram workspace. Connect the WEBPATH data
source to the Link Analysis node.
Select the Link
Analysis node. Set the value of the Association
Support Type property to Count.
Set the value of the Association Support Count property
to
1. This ensures that all
paths are captured by the Link Analysis node,
including visitors that requested just a single page. Set the Minimum
Confidence (%) property to 50.
Running the Link Analysis Node
In your diagram workspace,
right-click the Link Analysis node and click Run.
In the Confirmation window, click Yes.
Click Results in the Run Status window.
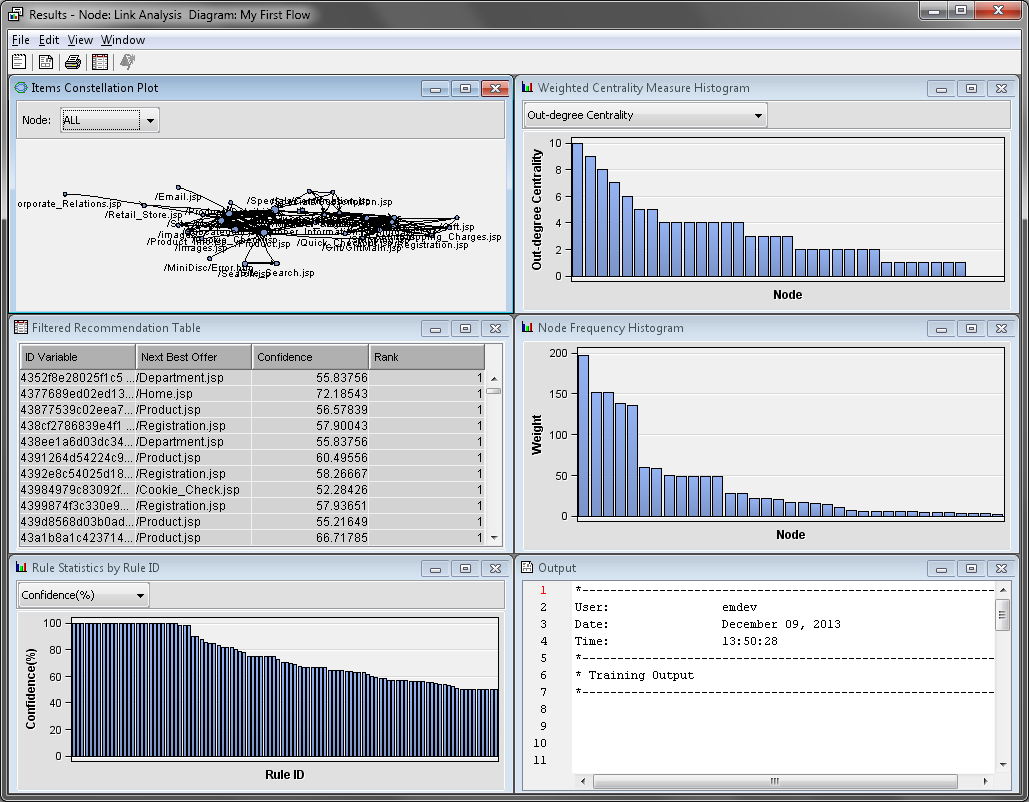
Maximize the Items
Constellation Plot window. The Items Constellation
Plot shows all of the links to and from each page. The
arrows indicate the direction of travel. In the upper left corner,
set the Node value on the drop-down menu
to /Cart.jsp. This puts the /Cart.jsp node
in the center of the diagram. The diagram now contains only the nodes
that are connected to /Cart.jsp.
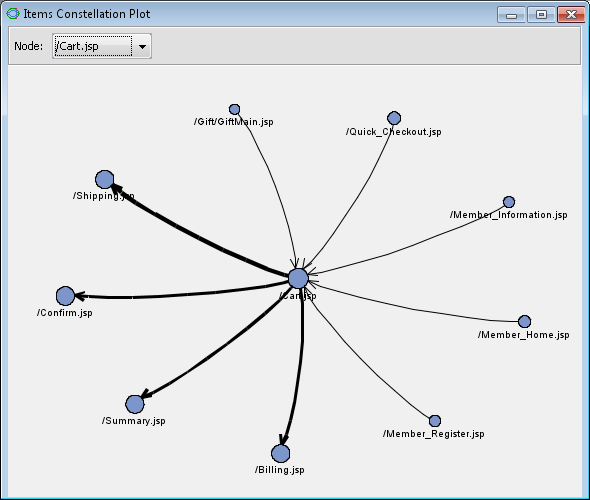
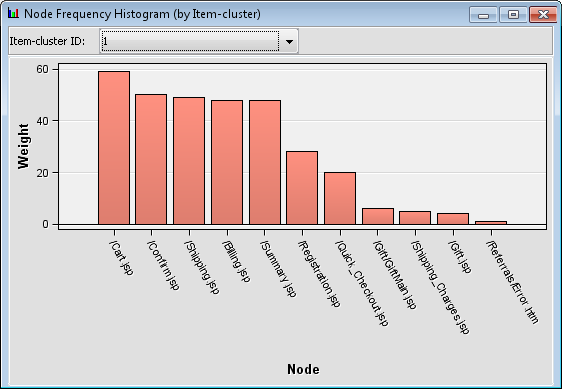
The thickness of each
arrow represents the relative frequency of that link. In this example,
the most frequent links appear to be from /Cart.jspto /Confirm.jsp, /Summary.jsp, /Billing.jsp,
and /Shipping.jsp.
Because SESSION_SEQUENCE
is a sequence variable, these links are directed. If you set the role
of SESSION_SEQUENCE to Rejected, then the
links are undirected. Undirected links would not detect the beginning
and ending web page, but would instead treat each direction as the
same path. For comparison, the undirected Items Constellation
Plot is shown below.
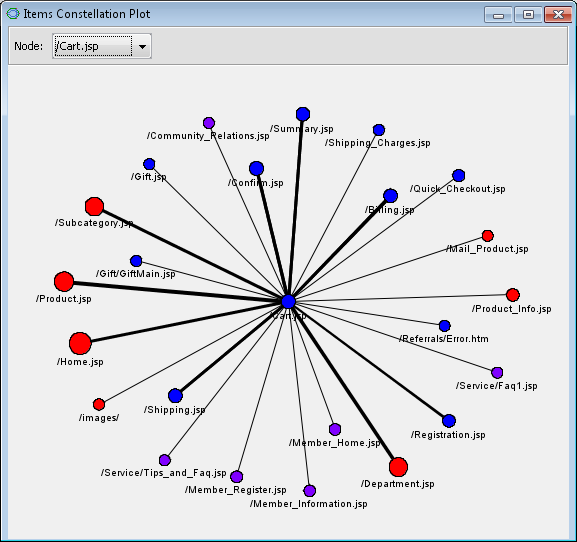
In addition to creating
undirected links, the Link Analysis node
performed item-cluster detection because there was no sequence variable.
The color of each node in the Items Constellation Plot indicates
the cluster that the node belongs to. Minimize the Items
Constellation Plot.
Copyright © SAS Institute Inc. All rights reserved.