Overview of Performance Monitoring
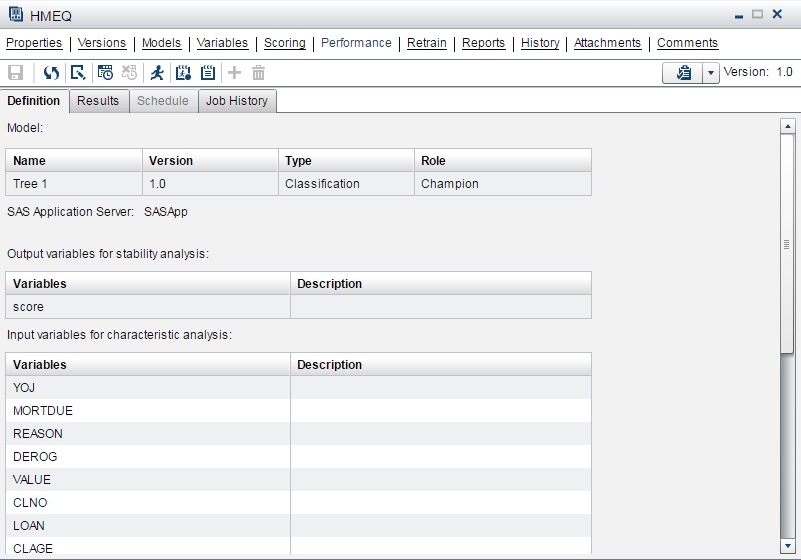
To ensure that a champion
model in a production environment is performing efficiently, you can
collect performance data that has been created by the model at intervals
that are determined by your organization. A performance data set is
used to assess model prediction accuracy. It includes all of the required
input variables as well as one or more actual target variables. For
example, you might want to create performance data sets monthly or
quarterly and then use SAS Decision Manager to create a
performance definition that includes each time interval. After you
create and execute the performance definition on the Performance page,
you can view the performance data through report charts in SAS Decision Manager.
These report charts give a graphical representation of the model's
performance. SAS Decision Manager also enables you to create
performance monitoring reports in PDF, HTML, and RTF output formats
from the Reports page.
Note: Performance monitoring is
designed to work only with a project that is associated with a classification
model function and has a binary target, or with a prediction model
function and has an interval target. Only models that are associated
with the classification and prediction model types and that are set
as champion and challenger models can be monitored for performance.
The following types
of output for performance monitoring are available:
-
Summaries of the types of information in project folders such as the number of models, model age distribution, input variables, and target variables.
-
Reports that detect and quantify shifts in the distribution of variable values over time that occur in input data and scored output data.
-
Performance monitoring reports that evaluate the predicted and actual target values for a champion model at multiple points in time.
You can create the performance
monitoring output, except for summaries, using either of the following
methods:
-
On the Performance page, generate the SAS code that creates the performance output and then execute the generated code.
-
Write your own SAS program using the report creation macros that are provided with SAS Decision Manager and submit your program as a batch job. You can run your SAS program in any SAS session as long as the SAS session can access the SAS Content Server.
After you create and
execute a performance definition, you view the report charts by selecting
the Results tab on the Performance page.
The report charts are interactive, and you can modify them to help
you assess the champion model performance. For example, you can show
markers in the charts and show tables for the different types of reports.
You can also select different variables for the x-axis and display
them in the chart for the Variable Distribution Report.
If you have flagged
a challenger model to compare with the champion model, you can use
the performance data that you collected for the champion model to
create reports for the challenger model. After all of the performance
monitoring definitions have been run, you can create a Champion and
Challenger Performance report that compares the champion model to
the challenger model.
Copyright © SAS Institute Inc. All Rights Reserved.
Last updated: February 22, 2017