Viewing Data Sources and Tables
Overview
For most directives
in SAS Data Loader,
data sources are Hive schemas that contain one or more tables. Data
sources are defined in Hive by your Hadoop administrator. If you do
not see the data source or table that you need, contact your Hadoop
administrator. If needed, the administrator can add a new Hive schema
and set appropriate user permissions for you to read and write data.
In some cases, data
sources are not based on Hive schemas. For example, data sources for
the Copy Data to Hadoop directive are RDBMS connections. Data sources
for the Import a File directive are delimited files that are stored
in the shared folder of the vApp.
When you open a directive
to create a job that runs in Hadoop, you select a data source and
a source table that is contained within that data source. If the directive
produces output tables, you then select a data source and a target
table at the end of the directive.
To protect your data,
target tables do not overwrite source tables. Target tables are not
required to be new tables each time you run your job. You can overwrite
target tables that you created in previous job runs.
As the
data is processed in each task in the job, you can view a sample of
the data that is produced in each task.
A typical Source Table
task includes a graphical view of the tables in the selected data
source.
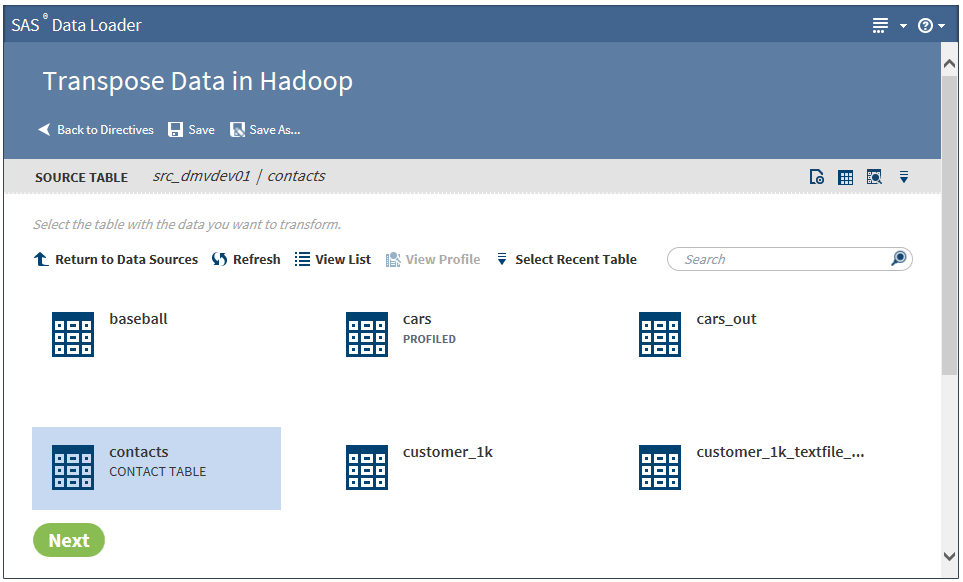
SAS Table Viewer icon 
Click to open the selected
table in the SAS Table Viewer, which provides column information and
sample data for the table.
View Data Sample icon 
Click to display the
first 100 rows of source data, as that data has been transformed up
to that point in the job.
 and
and 
Click the View List
icon to display data sources or tables as a list. When you view tables,
the list format displays the table name and description, along with
the dates on which the table was last profiled and last modified.
Note: The last modified date is
displayed only when the Identify each table as "new"
when created or modified setting is selected on the General
Preferences panel of the Configuration window. For more information,
see General Preferences Panel.
Click the View Grid
icon to display data sources or tables in a grid.

Click to view profile
information for the selected table. If a profile exists for a table,
PROFILED appears beneath the table name.
Click to choose from
a list of recently used tables. If you select a table from a different
data source, the source table information is adjusted accordingly.
The table that you selected is automatically highlighted.
Enter text in the search
field to filter the list of data sources or tables. The search feature
filters according to name when applied to data sources and according
to name and description when applied to tables.

Click to return to
the top of the page when viewing a long list of data sources or tables.
Tip
If you frequently work with
the same data source across multiple directives, you can have SAS Data Loader
select the most recently used schema automatically. This can help
you select source tables and target tables more quickly. To enable
this feature, click  , select Configuration, and
complete the following steps:
, select Configuration, and
complete the following steps:
-
Click General Preferences.
-
Select Automatically select the most recently selected hive schema.
About the SAS Table Viewer
How It Works
The SAS
Table Viewer displays sample data and column information for a selected
table. The viewer is available when you select source or target tables
or when you view results or status. The SAS Table Viewer opens in
a separate tab in the browser, so you can continue to reference that
information while working with directives.
To open the viewer,
click the Open the selected table in the table viewer icon  .
.
.
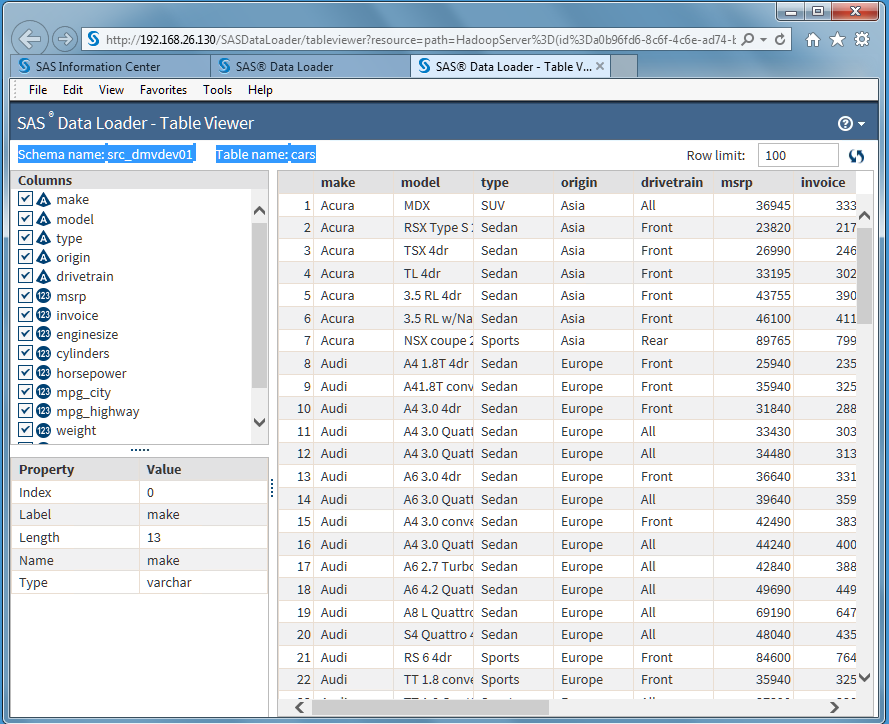
In the viewer, you can
click a column name to display the properties of that column. You
can also clear the check box next to the column name to temporarily
remove that column from the sample data view.
To change the number
of sample rows that are displayed, change the value of the Row
Limit field.
To refresh the sample
data after a directive has operated on that table, click the Refresh icon .
.
.
Column properties are
defined as follows:
Index
column number.
Label
a shortened version
of the column name that can be added to the data values for that column.
If a label is not assigned, then the column name is used as the label.
Length
the size of the table
cell (or variable value) in bytes.
Name
column name.
Type
tThe type of the data
in the column.
For information about
data types and data conversions in SAS and Hadoop, see the chapter
SAS/ACCESS Interface to Hadoop in the document SAS/ACCESS
Interface to Relational Databases: Reference.
Usage Notes
-
When viewing a SQL Server table, the following numeric data types are displayed in the Columns list with a character data type: datetime (datetime_col), money (money_col), smallmoney (smallmoney_col), numeric (numeric_col), and real (real_col).
-
Viewing the source and target tables of transformations can show differences in decimal values. The source columns show no decimal values, and the target shows full double-precision values. This difference exists in the display only. In the Hadoop distributed file system (HDFS), the values are the same.
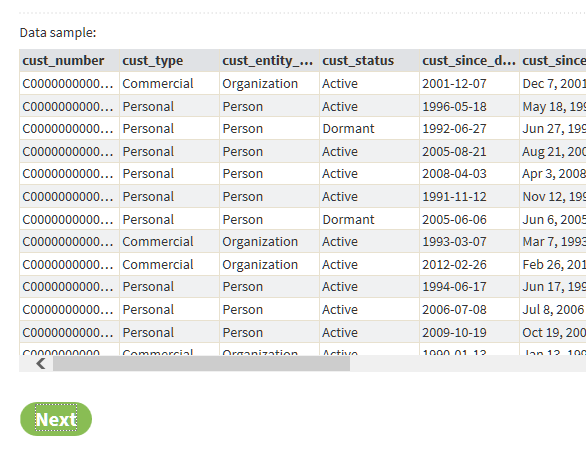
About the Sample Table Viewer
In directives that list
tables for selection, you can click the View a data sample icon to display a subset of the source data, as that data
has been transformed up to that point in the job. This gives you a
preview of your data before you run your job against the full source
table in Hadoop.
to display a subset of the source data, as that data
has been transformed up to that point in the job. This gives you a
preview of your data before you run your job against the full source
table in Hadoop.
In the data sample,
you can click Refresh to display the latest
data or click X to close the data sample.
Copyright © SAS Institute Inc. All rights reserved.