Viewing Stored Process Reports
About Stored Process Reports
A stored
process is a SAS program that is stored on a server
and that can be executed as requested by client applications such
as SAS Web Report Studio. The embedded SAS code can contain instructions
for rendering report elements as part of a larger report or for rendering
a complete report that includes queries, prompted filters, titles,
images, and statistical analyses. When a stored process is viewed
directly in SAS Web Report Studio, it is a stored process
report. Stored process reports contain only one section
and are automatically refreshed. All users can run a shared stored
process.
Note: Stored processes can also
be included as part of a larger saved report. For more information,
see Including Stored Process Output.
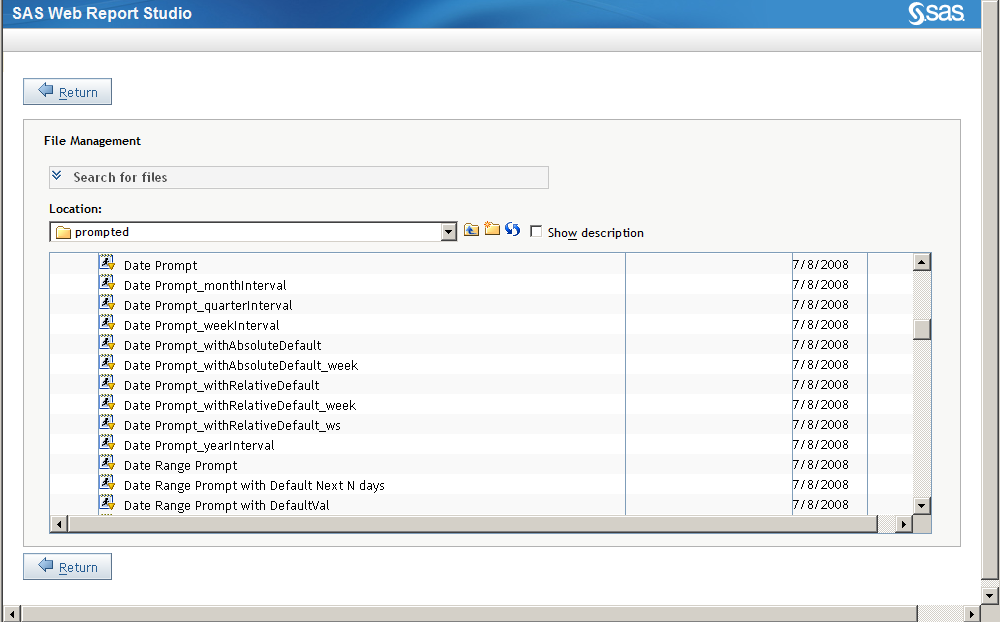
View a Stored Process Report
To view a stored process,
you can select one of the last four viewed stored processes from the File menu,
use the Open dialog box, or use the File
Management window.
To use the Open dialog
box or the File Management or Welcome windows,
complete these steps:
-
Double-click a stored process to view it. If you want to search for a stored process, complete steps 2a through 2g in View a Saved Report.
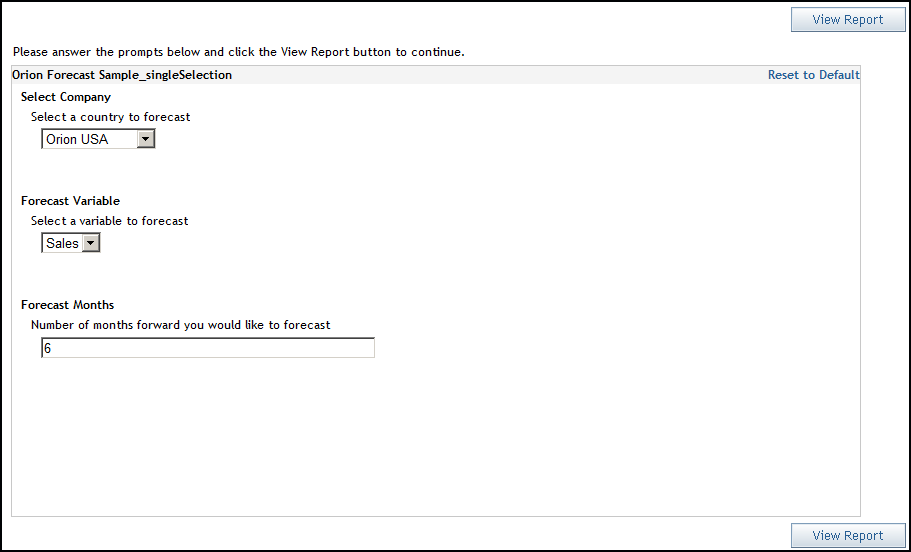
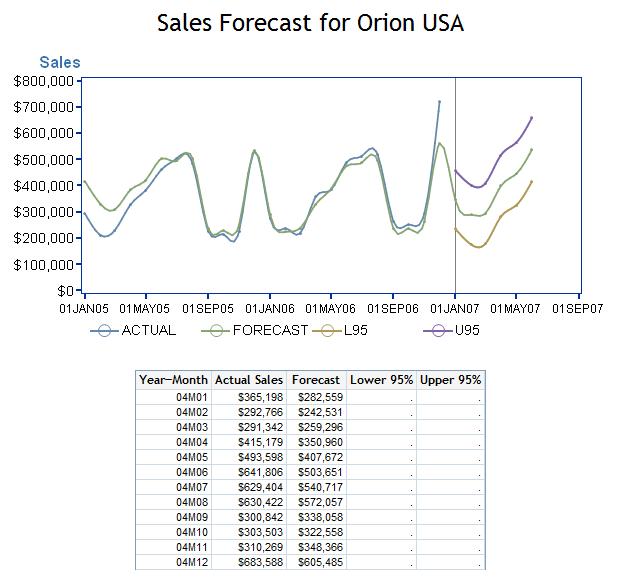
Example Report: Sales Forecast for Orion USA
The following example
of a stored process report uses the predictive capabilities of SAS
to give executives a glimpse into the company's financial future. After
the user enters preferences for the country, forecast variable (cost,
profit, or sales), and the number of months to forecast, SAS Web Report
Studio displays a line plot by month, including confidence intervals,
and a supporting list table with values for the year, month, actual
sales, forecast, lower 95%, and upper 95%. The prompt window for this
stored process is shown in the following display.
Prompt Window for the Stored Process Report Shown in Display
5.6
Tip
Some stored process reports
might support chart tips, tooltips, and drilling. Chart
tips contain data details and appear when you move the
mouse over particular areas on a graph. For example, moving the mouse
over the bars in a bar chart displays the data values associated with
the bars. A tooltip is a small pop-up informational
element displayed when the user positions the mouse over a chart element.
Other than changing
prompt values, you cannot modify the output of a stored process from
within SAS Web Report Studio. For information about
how to insert a stored process into a report, see Insert a Stored Process. If you insert a stored process into a report, you can perform
some layout design tasks that are independent of the stored process
report. For example, you can add images, headers, and footers.