Using Standard Data Items in a Query

About Standard Data Items

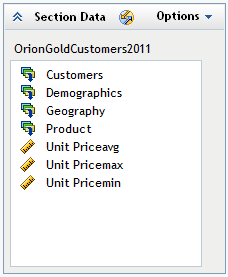
Each data source includes one or more standard data items. You decide which data items to use to define a query for a report section. You can use all the data items in the data source or a subset of data items. Each standard data item is classified as either a category, a hierarchy, or a measure.
Category category icon
A data item whose distinct values are used to group and aggregate measures. There are four types of categories: alphanumeric, date, timestamp, and time. Alphanumeric categories can be made up of all letters, all digits, or a combination of the two. Categories that have values that are all digits might be physically stored as character or numeric data. The data type affects how values are handled in relation to some functionality, such as filtering, sorting, and formatting.
Examples of alphanumeric categories include data items such as Product ID, Country, Employee Number, and Employee Name. Date, timestamp, and time category examples are Order Year, Date of Sale, and Delivery Time.
Measure measure icon
A data item whose values can be used in computations. Usually, these values are numeric. Examples of measures include Sales Revenue, Units Sold, and Salary.
The default format of a measure is specified by the data source that contains it. You can modify the format of some measures.
Every measure has a default aggregation method, which is specified by the data source that contains it. In some cases, you can change the method. However, if you use a measure as part of a custom data item, then the measure is always calculated by using the default aggregation method.
Hierarchy hierarchy icon
An arrangement of the levels in a dimension from general to specific. The first level in the hierarchy is the root level.
For example, a common dimension in a multidimensional data source is Time. A dimension that is named Time might have a hierarchy named YrQtrMth. Such a hierarchy might enable you to look at data for each Year (the root level), drill down to see the data for each Quarter (second level) in a specific year, and then drill down to see the data for the three Months (third level) that make up a particular quarter.
Hierarchies are available only in multidimensional data sources.

Select Standard Data Items

To select the standard data items that you want to use in the query for the current report section, complete these steps:
  1. In the Section Data panel, select Optionsthen selectSelect Data to open the Select Data dialog box.
  2. On the Standard tab, a data source is selected by default. If there are no data sources available, contact your data source administrator.
    To use a different data source, complete these steps:
    1. Click Select Data Source.
    2. In the Select Data Source dialog box, navigate to the location of the data source that you want to use. Each data source appears with an icon that indicates its type.
      Icon
      Type of Data Source
      relational or multidimensional information map icon
      relational or multidimensional information map
      relational information map icon
      relational information map
      multidimensional information map icon
      multidimensional information map
      table icon
      table
      cube icon
      cube
    3. Click OK.
  3. (Optional) To find a data item in the selected data source, complete these steps:
    1. Click data item find icon on the Standard tab.
    2. Type your search term.
    3. Click Find Next to locate each instance of the data item.
    4. Click Cancel.
  4. In the Available data items list box, select one or more data items, and then click single right arrow icon to move them to the Selected data items list box. This adds the data item or items to the query. Some users will be able to move all data items in the data source by clicking double right arrow icon.
    Select Data Dialog Box Showing Four Categories and Three Measures Selected from a Multidimensional Data Source
    Select Data Dialog Box Showing Four Categories and Three Measures Selected from a Multidimensional Data Source
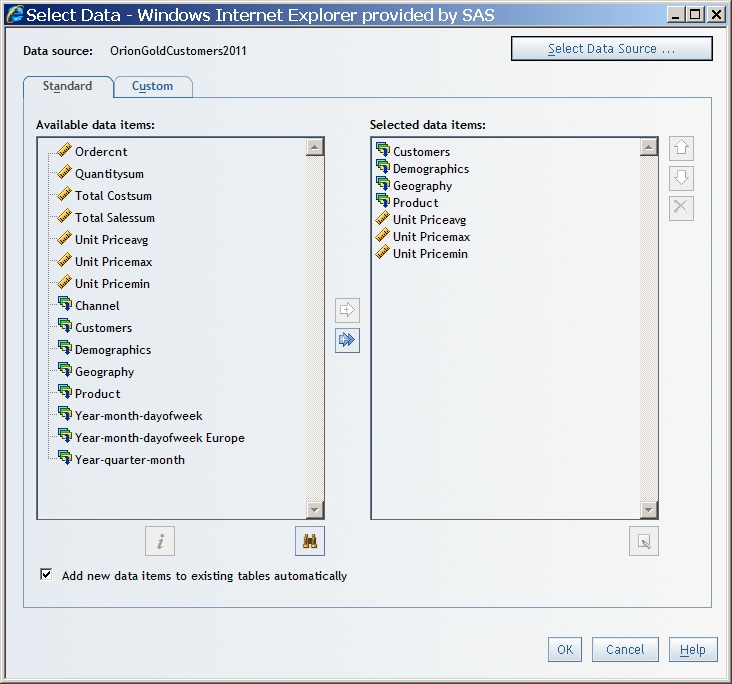
    Note: To view the data type and description for a data item, select a single data item in the Available data items list box, and then click data item information icon.
    Note: For relational data sources, you can select the same measure multiple times, rename each instance of the measure (see step 7), and apply a different aggregation to each instance of the measure (see Modify How a Measure Is Aggregated).
  5. (Optional) Reorder the data items in the Selected data items list box. To move a selected data item up or down in the list, use up arrow icon and down arrow icon. The order in which the data items appear in this box is used to assign the data items to default functions in graphs and tables.
    Note: Existing tables and graphs are not affected by reordering data items.
  6. (Optional) To rename a category or measure, select it in the Selected data items, and then click rename data item icon.
    Note: You cannot rename hierarchies.
  7. (Optional) Clear the Add new data items to existing tables automatically check box if you do not want new data items automatically added to existing tables. (Adding new data items to tables might affect existing filters, percent of total calculations, and conditional highlighting.) If you clear this check box, then new data items that are added to the Selected data items list box are hidden from existing tables. If you want to move a hidden data item to a row or a column in an existing table, then use the Assign Data dialog box to make that change.
    Note: This option is not available if there are no existing tables.
    For existing crosstabulation tables that have at least one category assigned to Columns, additional data items are assigned to the Rows function. If you add measures, the additional measures are assigned to whatever function the current measures are assigned to. That is, if measures are currently assigned to Rows, then the additional measures are also assigned to Rows. For list tables, if this option is selected, new data items are added to the Columns function.
  8. Click OK.
    Section Data Panel Showing the Standard Data Items Selected for the Query
    Section Data Panel Showing the Standard Data Items Selected for the Query
    Note: To collapse the Section Data panel, click collapse panel icon.
You can modify the data item selection. For more information, see the following topics:

Rename a Standard Data Item

Note: You cannot rename hierarchies.
To change the name of a category or measure, complete these steps:
  1. In the Section Data panel, select Optionsthen selectSelect Data to open the Select Data dialog box.
  2. Click the Standard tab.
  3. Select a data item in the Selected data items list box.
  4. Click rename data item icon .
  5. In the Rename Data Item dialog box, type the new name, and then click OK.
  6. Click OK.

Remove Standard Data Items

To remove a standard data item from the Section Data panel, complete these steps:
  1. In the Section Data panel, select Optionsthen selectSelect Data to open the Select Data dialog box.
  2. Select the Standard tab.
  3. Select a data item in the Selected data items list box.
  4. Click delete icon to remove the data item from the Selected data items list box. Here are some consequences of removing data items from a section query:
    • If you remove a time hierarchy, then any custom data items that are based on time functions are removed from all objects in the report section.
    • If you remove a data item that has been assigned to a table or a graph, that data item is simultaneously removed from the table or the graph.
    • If you remove the geographic hierarchy, then any geographical map in the section becomes invalid.
    • If you remove a category or hierarchy that is being used in a report linking prompt, then the prompt association is removed. The link to the target report will still work. However, you must complete the prompt window to display the report.
    • If you remove a data item that is being used in a percent of total calculation, then the percent of total calculation is removed from the table.
    • If you remove a measure that is being used with a group break or in text, then the measure information is removed from the report section. For example, if you included Profit with a group break for Product, then the Profit information is removed.
  5. Click OK.