The number of group
break levels that you can create depends on how many categories or
hierarchies are in the report section. For example, if you have three
categories and two hierarchies, then you can specify four breaks,
which means that you will see one drop-down list for
Break
by values of and three drop-down lists for
Then
by values of.
Note: Group breaks cannot be used
on different levels of the same hierarchy.
Data items that act
as hyperlinks are not allowed to be group break variables, so they
are always removed from the list.
To specify group breaks,
complete these steps:
-
In Edit mode, select
Data Group Breaks
 or from the
Table of Contents panel,
select
OptionsGroup
Breaks to open the
Group Breaks dialog
box.
-
On the
Group
Breaks tab, complete these steps:
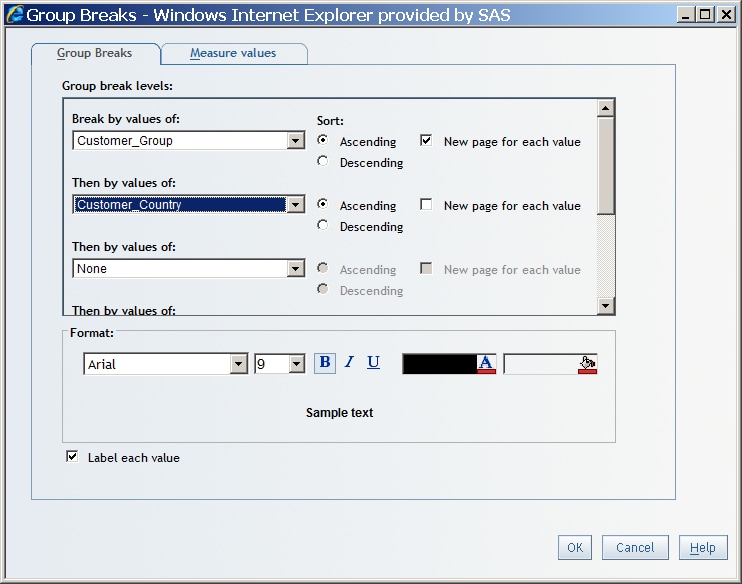
-
Select the first group
break level in the
Break by values of list.
The
Break by values of list contains all
the categories and hierarchy levels in the report section.
Note: If you select a data item
that is already assigned to a table or graph, it will be removed from
that object.
-
(Optional) Select additional
group break levels from any available
Then by values of list.
-
Select a sort option
for the category or hierarchy level values. The default is
Ascending.
Note: If the data cannot be sorted,
this option is not available.
-
(Optional) Select the
New
page for each value check box.
-
(Optional) Use the formatting
tools to change the default font, font size, font style, background
color, and foreground color.
-
(Optional) Select the
Label
each value option to label each group break with its
category or hierarchy name. If you include a dynamic measure with
one or more group breaks, then this option also applies to labeling
measures.
For multidimensional
data, select the
Label each value option
to label each group break with the hierarchy and level names, followed
by the value (for example,
PRODHIER.PRODNAME:
Furniture.Bed).
Group Breaks Tab in the Group Breaks Dialog Box
-
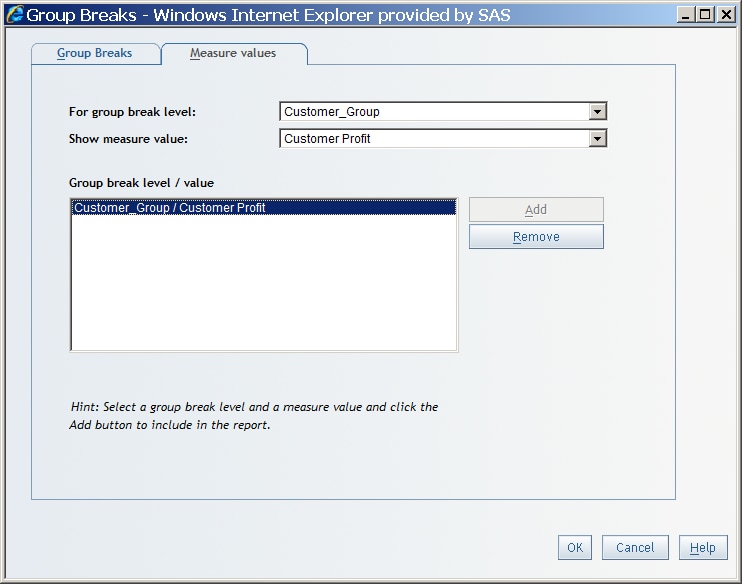
(Optional) Use the
Measure
values tab to complete these steps:
-
Select a group break
in the
For group break level drop-down list.
The list contains the group breaks that you selected on the
Group
Breaks tab.
-
In the
Show
measure value list, select the measure value that you
want to display for each group break level. For example, if you select
Country as
the group break level, you might select
Total Profit as
the data item value. The profit aggregated across each country is
displayed at each group break level.
Note: The measure value is an aggregation
for each group break that you selected.
Measure Values Tab in the Group Breaks Dialog Box
Note: If you remove the selected
measure from the report, then the measure value is removed from the
group break.
-
Click
Add
to add your
For group break level and
Show
measure value selections to the
Group break level/value box.
-
For reports that contain
tables, graphs, or geographical maps that have been filtered, drilled,
or expanded, these actions are taken:
-
Filters and conditional highlighting
that depend on a data item that you have selected as a group break
are removed from the filtered table, graph, or geographical map.
-
Navigation (drilling or expanding)
that has been performed on a data item that you have selected as a
group break are removed from the drilled or expanded table, graph,
or geographical map. (Expanding and drilling are performed in View
mode.)
In addition, if you
create a group break that is based on any level in a geographic hierarchy,
then any geographical map in the report section becomes invalid.
Note: To collapse the
Group
Breaks section, click

.
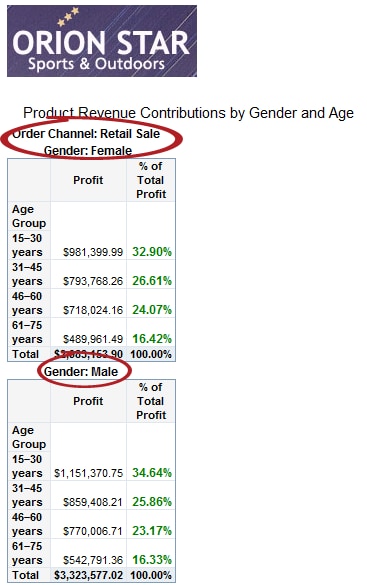
Here is an example of
how group breaks appear in a report that is based on multidimensional
data:
Group Breaks for Multidimensional Data