How Filtering and Ranking Can Help with Analysis
SAS Web
Report Studio enables you to filter and rank the data in tables, graphs,
and geographical maps. The filters that are applied to a report are
different from the filters that are applied to an information map,
table, or cube. For more information about filters that are applied
to data sources, see Overview of Section Filters.
Filters
are simply a set of rules, or conditions, that you specify to subset
the data that is displayed in a table, graph, or geographical map.
The goal is to display only the data that you need to see to perform
your analysis. For example, you might have a crosstabulation table
that shows all sales in a variety of countries for the years 2009
and 2010. Spending is split between males and females. For a promotional
mailing, you might want to filter the table so that it only contains
information for 2009 where females spent more than $100,000.
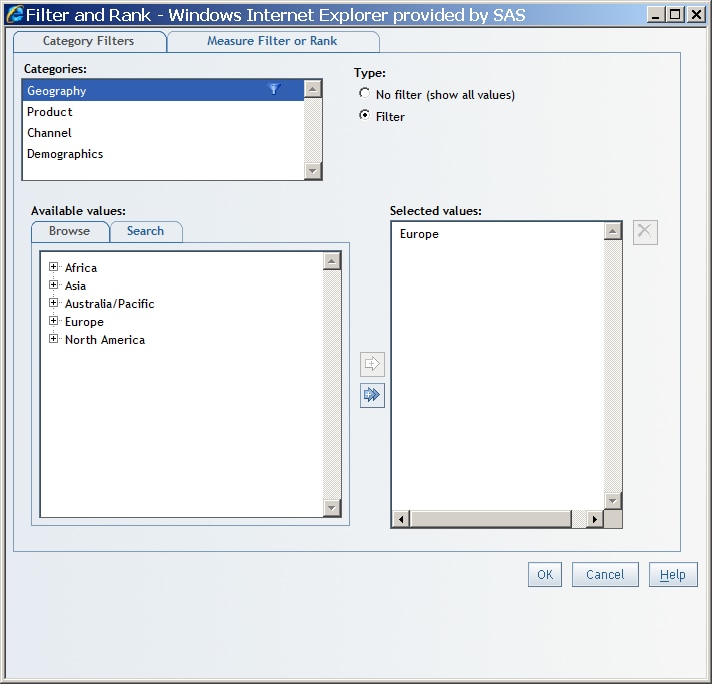
The following
display shows an example of the Filter and Rank dialog box when a filter has been applied to a specific geography.
Notice that the following funnel icon appears next to Geography in the Categories list:  . This icon tells you that a filter or rank has been
defined for that data item. If you have performed a drill or expand
operation on a data item that has masked the effect of the filter,
then this icon becomes dimmed. This tells you that the filter is defined,
but it is not currently in effect.
. This icon tells you that a filter or rank has been
defined for that data item. If you have performed a drill or expand
operation on a data item that has masked the effect of the filter,
then this icon becomes dimmed. This tells you that the filter is defined,
but it is not currently in effect.
The Browse and Search tabs for
relational data are currently used in the Filter and Rank dialog box for list tables, crosstabulation tables, and graphs when
the data source is relational. You do not specify an operator in this
case. However, the implied operator is Equal to. For more information,
see Browsing or Searching for Filter Values.
The Browse and Search tabs for
multidimensional data are currently used in the Filter and Rank dialog
box. They let you select filter values for a multidimensional data
item. You do not specify an operator in this case. However, the implied
operator is Equal to. For more information,
see Browsing or Searching for Filter Values.
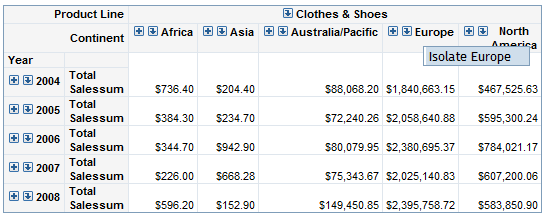
You can
apply a filter when you are viewing a table. Select a row or a column
and then right-click and select Isolate.
In the following display, the right-click menu shows Isolate
Europe for the total sales summary for retail sales in
the crosstabulation table.
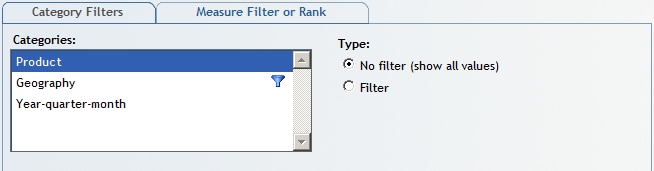
After
you isolate the row or column, the Filter and Rank dialog box shows that category as having a filter. For the preceding
example, the Geography category in the Categories
list displays with this icon: .
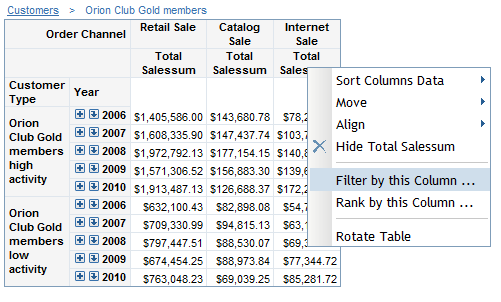
For crosstabulation
tables based on relational data sources, you can apply a filter value
by selecting Filter by the Column, Filter by this Row, Rank by this Column, or Rank by this Row.
Rankings
order observations according to values of particular measure data
items. In this case, the goal is to provide a different view of the
data to help you perform your analysis. For example, a bar chart might
show revenue for two sales channels for the years 2006, 2007, 2008,
2009, and 2010. You want to rank the chart so that it shows where
the top 10% of sales came from in each year. The ranked graph might
show that the top 10% of sales for each year came from catalog sales.
Based on this information, your company might want to expand catalog
mailings.