Managing Conditional Highlighting for Graph Values
Add Conditional Highlighting to Graph Values
To specify conditional
highlighting for values in a graph, complete these steps:
-
Right-click
in the graph, and then select
Conditional Highlighting to open the
Conditional Highlighting dialog
box.
-
-
Select
the
Condition that you want the selected
measure to match.
-
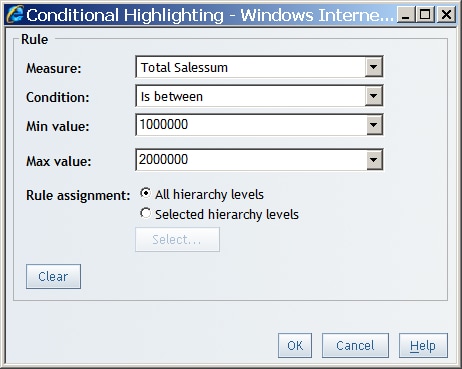
In the
Value field, type in a value or select a measure in
the drop-down list. If you selected
Is between as the condition, then type a
Min value and a
Max value. If you selected
Is missing value as the condition, then this field is
unavailable.
Note: If you are
creating a condition for percentages, you must enter the conditional
value as a decimal number. For example, if you want to filter for
values above 50%, enter
.5 as the conditional
value.
Conditional Highlighting for Values Between a Minimum and a
Maximum Value
-
For graphs,
the
Rule Assignment option lets you specify
which hierarchy level the rule will be applied to. You can specify
one of the following:
-
All hierarchy levels, which applies the rule to all hierarchy levels.
-
Selected hierarchy
levels, which applies the rule only to the hierarchy
levels that you specify. Click
Select. Select
the specific hierarchy levels for the rule. Click
OK.
-
Remove Conditional Highlighting from Graph Values
To remove conditional
highlighting from graph values, complete these steps:
-
Right-click
in the graph, and then select
Conditional Highlighting to open the
Conditional Highlighting dialog
box.
-
-
Copyright © SAS Institute Inc. All rights reserved.