Viewing Reports Created in SAS Web Report Studio

About Reports Saved in SAS Web Report Studio

Reports in SAS Web Report Studio are saved when you use the Save As dialog box. A saved report contains at least one section. Typically, that section uses at least one query method (data items from a data source or a stored process). If data items are used, then the section has at least one view element (a table, graph, or geographical map) to display the results of the query.
A report might be automatically or manually refreshed, shared or private, or read-only (which means that only the report author can make changes to it). It might also be prompted (which means that users must answer prompts before the report is rendered).

View a Saved Report

To view a saved report, you can select one of the last six viewed reports from the File menu or the Welcome window, or use the Open dialog box or the File Management window.
To use the Open dialog box or the File Management window, complete these steps:
  1. Perform one of these tasks:
    • Select a report from the Welcome window, which also shows the last six viewed reports. If you are editing or viewing a report, select Filethen selectClose to display the Welcome window.
    • Select Filethen selectOpen to display the Open dialog box.
    • Select Filethen selectManage Files in the Welcome window or in either Edit or View mode.
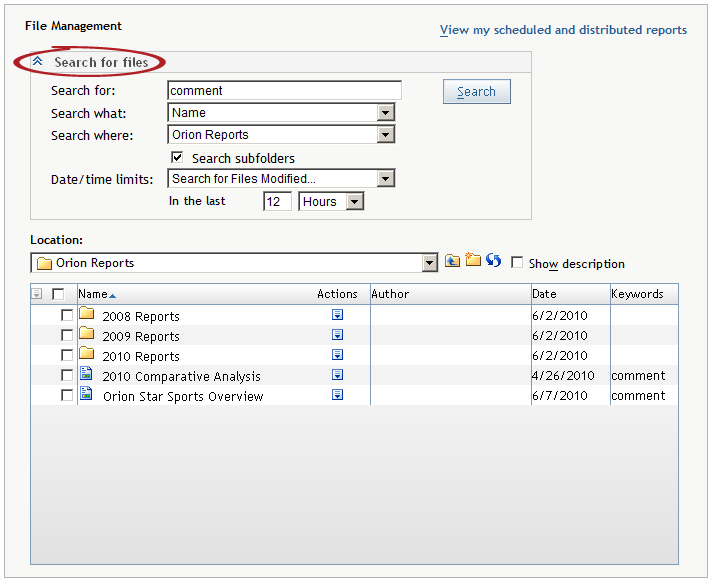
      The Open dialog box and the File Management window contain a Search for files section that can be expanded or collapsed at the top of the window.
      File Management Window with the Search for Files Section Expanded
      File Management Window with the Search for Files Section Expanded
  2. Double-click the name of a saved report to open it in View mode. Next to the name of the report, you can also click action icon in the Actions column and then select Edit. If you want to search for a report, complete these steps:
    1. If the Search for files section is not visible, click expand pane icon.
    2. In the Search for field, type the text for which you want to search. For searching tips, see Searching for Reports and Stored Processes.
    3. In the Search what drop-down list, choose whether you want to search for the text in the Name, Description, or Keywords field.
      Note: You cannot search the content of a report or a stored process.
    4. In the Search where drop-down list, select a folder name.
    5. (Optional) To also search for reports in folders that are contained in the folder that you are searching, select Search subfolders.
    6. (Optional) To limit your search by time, select Search for Files Modified in the Date/time limits drop-down list. Specify the time frame by using the fields that are below the drop-down list.
    7. Click Search. Any reports or stored processes that match your criteria are shown.
      Note: After a search, the report list also includes Path information for each located report. To clear the search results, select an option in the Location drop-down list.
  3. If necessary, respond to prompts and then click View Report.
Tip
If the currently displayed report section includes output from a stored process, you can select Helpthen selectView Log to view a log for the stored process.

Example Report: Product Group Revenue Contributions by Age

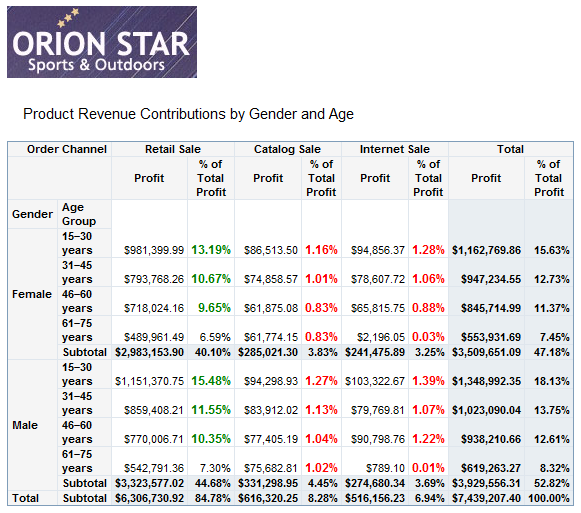
The following display provides information about product group revenue and includes percentage contributions by order channel, gender, and age group. Exceptional conditions are highlighted for product group and age group combinations for a given channel when the revenue contribution is less than 5% or greater than 8%. For example, this information could be used to decide which age groups to target for a promotional offering.
Example of a Saved Report that Contains Conditional Highlighting
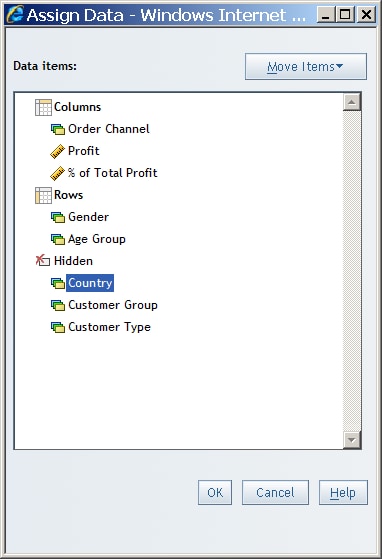
For both multidimensional and relational data, you can hide a data item from the table or graph. For example, in the company report here, the data item for Country is hidden. You can hide data items by right-clicking in a table or graph and selecting Hide from the context menu or you can use the Assign Data dialog box.
Assign Data Dialog Box with a Hidden Data Item Selected