How Drilling and Expanding Affects Other Table, Graph, and Geographical Map Features
How Drilling and Expanding Affects Filtering and Ranking
SAS Web
Report Studio shows if a filter or rank has been defined for a data
item. In either the Categories or Data Item list in the Filter and Rank dialog box, you
see the funnel icon ( ) if the filter is in effect. If you have performed
a drill or expand operation on a data item that has masked the effect
of the filter, then this icon becomes dimmed. This tells you that
the filter is defined, but it is not currently in effect. If you select
a data item with a disabled filter, a message tells you that the filter
is not in effect and gives a general explanation of why.
) if the filter is in effect. If you have performed
a drill or expand operation on a data item that has masked the effect
of the filter, then this icon becomes dimmed. This tells you that
the filter is defined, but it is not currently in effect. If you select
a data item with a disabled filter, a message tells you that the filter
is not in effect and gives a general explanation of why.
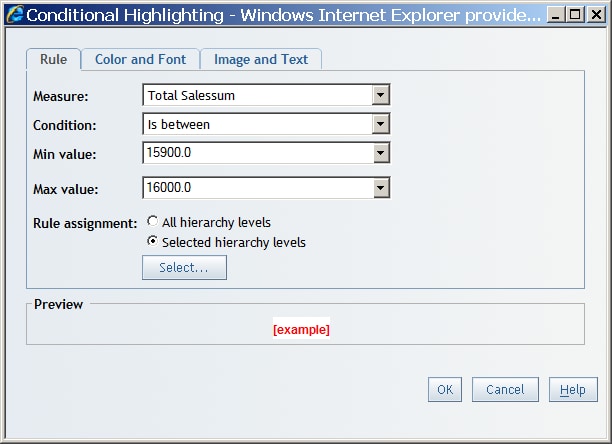
How Drilling and Expanding Affects Conditional Highlighting in Tables and Graphs
When you
define conditional highlighting, there is an option to apply the rule
either to the selected levels of displayed dimensions or to any level
of displayed dimensions. In the Conditional Highlighting dialog box, there are two selections for Rule assignment: All hierarchy levels or Selected
hierarchy levels.
How Drilling and Expanding Affects Panning and Zooming in a Geographical Map
You can
indirectly remove panning or zooming in a geographical map by drilling
or expanding. For example, you drill into a region (or pan to a certain
area) and then use the breadcrumb to drill up. The drill-up operation
takes you back to the state that the geographical map was in before
you performed the drill and pan operations. You are not positioned
in the panned results when you drill up.