How Conditional Highlighting Can Help with Analysis
Conditional
highlighting is used to direct a report viewer's attention to specific
report results. For example, a report author might design a report
on suppliers so that table cells that contain delivery times that
are greater than 14 days are automatically highlighted with a red
background. You can also add, modify, or delete conditional highlighting
when you view a report. For example, you might want to highlight delivery
times that are less than five days instead of greater than 14 days.
Note: Conditional
highlighting is measure-based, so the table or graph must include
at least one measure that can be used in the condition.
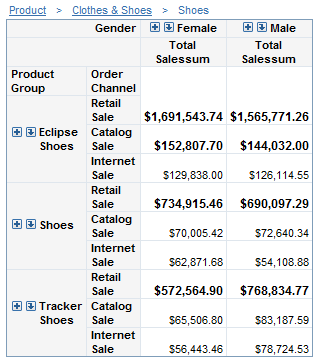
For tables,
SAS Web Report Studio has a variety of options for highlighting results
that meet the specified conditions. In the following display, total
sales values that are greater than $130,000 are bold. In addition,
an image or user-supplied text can be placed to the right or left
of the revenue value, or they can replace the revenue values.