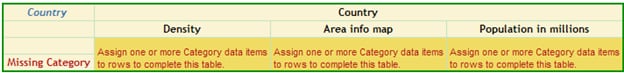
If a table
or a graph (other than a geographical map) is missing one or more
required role assignments, it appears with sample data and a message
that indicates what is needed. The following display shows a crosstabulation
table that cannot be fully rendered because no data items are assigned
to the rows.
Example of an Incomplete Table
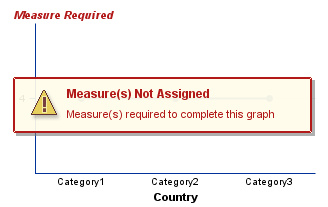
The following
display shows a graph that cannot be fully rendered because no category
data item is assigned to the X axis.
Example of an Incomplete Graph
Here are the requirements
for tables and graphs:
-
All data item labels must be unique.
-
All multidimensional tables and
graphs (other than scatter plots and bubble plots) require a category.
-
All multidimensional tables and
graphs require at least one measure.
-
All bar-line charts and scatter
plots require at least two measures.
-
All bubble plots require three
measures.
-
All relational scatter plots and
bubble plots require a category.
-
All geographical maps require a
geographical data item in a data source (information map).
Here are
some ways that you can update an incomplete report element in View
mode so that the report renders correctly:
-
Select a data item in the
Section Data panel, and then drag it where you want
it in the report element. Hotspots appear over the report element
to indicate the appropriate places to drop the data item.
-
For a crosstabulation table, select
a data item in a table, and then drag and drop it on another location
in the table.
-
Right-click in the report element,
and then select
Assign Data to open the
Assign Data dialog box. Then use drag and drop features
to assign any missing data items. You can also use the
Move Items drop-down list to assign any missing data
items.
-
If your original data selection
does not have enough data items to complete a report element, select
Data Select Data
 to open the
Select Data dialog
box. Then select additional data items from the list of available
data items in the data source.
-
If there are duplicate data item
labels, use the
Section Data panel to rename
the labels and make them unique.
Categories
that are used as group break items cannot also be used as visual data
items in a report element in View mode. In some cases, you might need
to remove a group break to make a category available. Once the category
is available, you can make it visible to complete the report element.