Guidelines for Defining Indicator Data
Define the Data to Suit the Indicator
Use the following guidelines
to define data that suits the indicator:
-
Determine the indicator types to use with the indicator data and the required appearance of the resulting indicator. Then, plan the indicator data to meet your needs.For example, gauges in a KPI indicator appear best with indicator data that produces summarized data with a limited number of data rows. If you use indicator data with significant amounts of data to drive a KPI indicator, SAS BI Dashboard attempts to produce one KPI gauge representation for each row of data in the indicator data. For significant amounts of data an indicator type that automatically summarizes the data is preferable. Bar charts are an example of this type of indicator.
-
An indicator type might support only certain date formats. Make sure that your data uses only the date formats that are supported by your selected indicator type. If the data uses a format that the indicator does not support, the date might not display correctly in the indicator.
Design the Data for Efficient and Responsive Dashboards
Create indicator data
so that it executes quickly.
-
(Information Map data sources) When you open an indicator data object, the Query Results tab is populated with data. If it takes awhile to for the query results to appear, it is a good indication that you should consider summarizing the data or changing the information map to be more efficient. If the query is slow when you are defining the indicator data object, it will also be slow when executing from a dashboard.
Aggregate or Summarize the Data
It is a best practice to aggregate the data as much as
possible. Doing so ensures the best performance in a dashboard and
avoids unexpected results, such as too many rows or gauges, or incorrect
summaries.
-
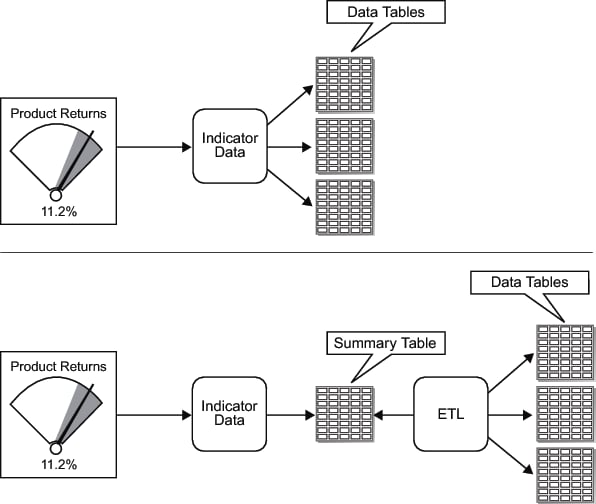
Summarize data at the indicator data or in the source data. Do not rely on the indicator to perform the summary.TipFor an SQL query, you can summarize data using aggregation functions such as AVG() and the distinct keyword.Another summarization strategy is to summarize the data into a summary table. The summary table is then used as the basis for the SQL query or as the base table for the information map. In the following figure, the first illustration shows the SAS BI Dashboard indicator data using a query that combines data from multiple tables. The second illustration shows the same two tables being summarized by an ETL program. The SAS BI Dashboard indicator data then uses this summarized table.
-
Some indicator types support summarizing or averaging data. For a list of these indicator types, see Indicator Types that Aggregate Data.
Miscellaneous Guidelines
-
(OLAP Information Map data sources) The data returned from an OLAP information map is flattened into a two-dimensional table structure. You assign a role for each dimension when you define the data source. The roles are Column, Row, and Slicer.For dimensions with the role of Row, the levels of each hierarchy are the data fields. The corresponding members of the level are the values of the data field, where the field name is the label for the level. The other data fields are the columns that are typically seen in an OLAP viewer. The field names for the data fields are the comma-delimited levels of the dimensions with the role of Column, in the order of the dimensions with the role of Row.