SAS BI Dashboard Features
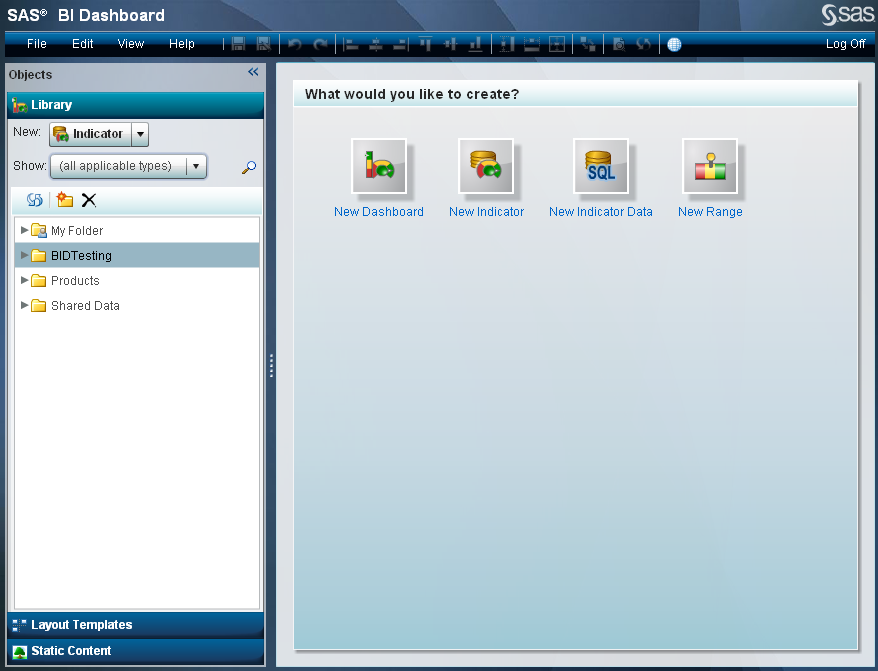
SAS BI Dashboard Designer
The SAS BI Dashboard
designer, version 4.3 or later, provides a new, interactive, and intuitive
interface. Now you can drag and drop objects onto the dashboard that
you are designing. You can also resize indicators by using your mouse.
New features assist you in laying out dashboard content precisely.
The designer now provides a real-time, what-you-see-is-what-you-get
view of the dashboard while you are designing it. The dashboard designer
also now provides many more indicator types to use in a dashboard,
as well as new graph styles to enhance the appearance of indicators.
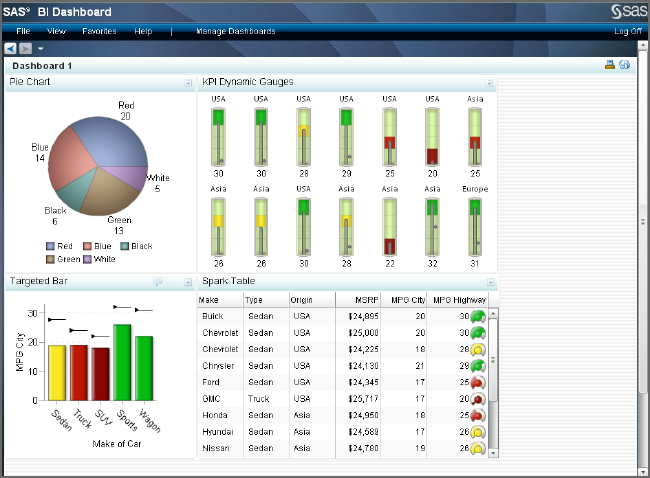
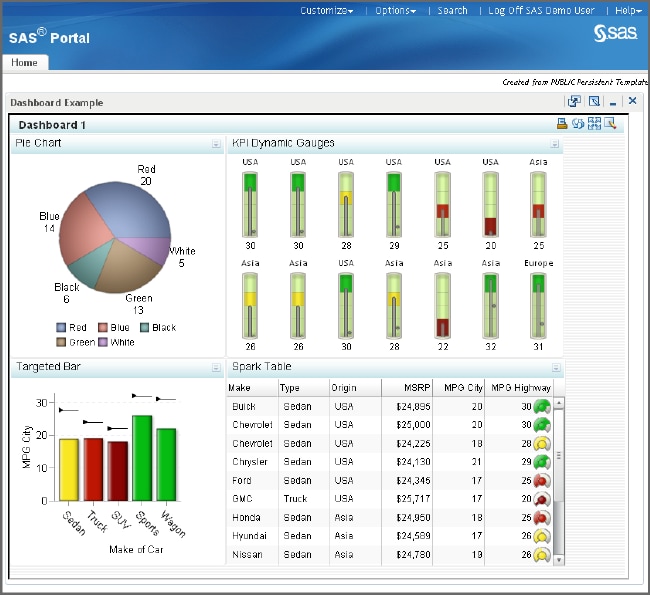
SAS BI Dashboard Viewer
By creating dashboards,
designers provide data to their business users. Business users can
view these dashboards in the SAS BI Dashboard viewer.
The SAS BI Dashboard
viewer, version 4.3 or later, provides new features for bookmarking
favorite dashboards and indicators, sharing comments with other business
users about indicators in a dashboard, creating personalized alerts,
and viewing data in a more interactive way.
It is easy to move between
the dashboard designer and the new dashboard viewer. Designers can
create a new dashboard, effortlessly view it in the dashboard viewer,
and then quickly return to the dashboard designer again. Or, designers
can use the Preview feature and view the dashboard and most of its
features without leaving the dashboard designer at all.