Indicator Interactions
Overview
Indicator
interactions present dashboards with which a dashboard user can interact,
enabling the user to explore data directly from within the dashboard.
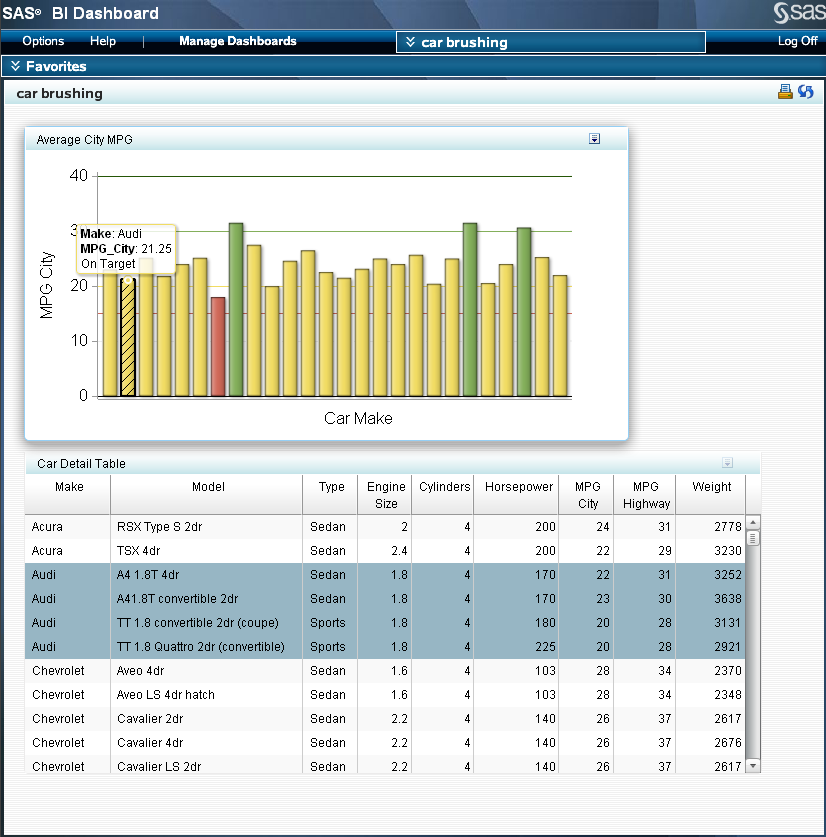
Example
Here is an example
of a dashboard with two indicators. There is no interaction set up
between them, so as a dashboard user explores data in one indicator,
the other indicator remains static.

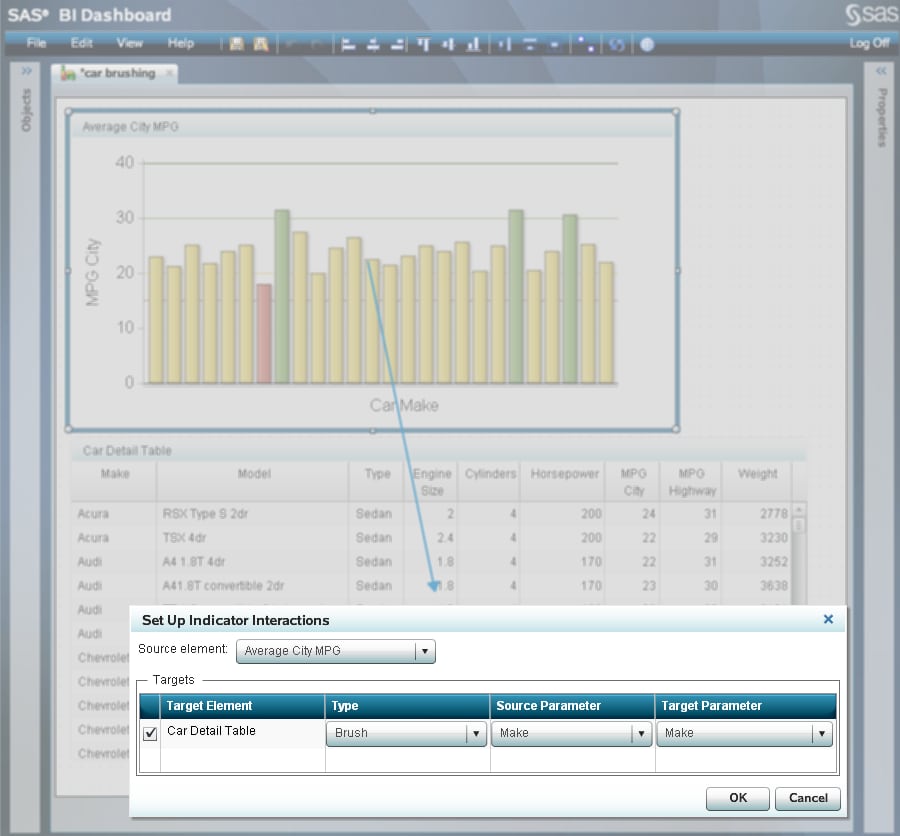
A dashboard
administrator then modifies the indicators in the dashboard designer. The
dashboard administrator sets up an interaction so that the source
parameter Make in the Average City MPG indicator
is mapped to the target parameter Make in
the Car Detail Table indicator, and then selects the brush (highlight) interaction.
In the dashboard designer,
this indicator interaction is shown by an arrow from the Average City
MPG indicator to the Car Detail Table indicator
Parameter Mapping
For maximum
flexibility, the source parameter and the target parameter are not
required to have the same name; they merely need to reference the
same type of data. For example, the source indicator can have a data
column named REGION_ID and the target indicator can have similar data
contained in a data column named SALES_REGION_ID. By mapping REGION_ID
to SALES_REGION_ID, you link together the two data columns.
Further,
the data can be contained in different data sources and different
types of data sources. For example, a source indicator can have indicator
data from an SQL query that maps to a target indicator that has indicator
data from a stored process.
Note: If you define
an indicator with both a hyperlink and an interaction, the hyperlink
takes precedence over the interaction when the hyperlink opens in
the same window as the interaction. For example, if you create a dashboard
that opens a report and that interacts with another indicator, when
the dashboard user clicks the indicator, the report opens in the current window.
If the hyperlink opens in a new window, then the dashboard user sees
the interaction in the current window and the hyperlink in a new window.
Brush Interaction
Client-Side Filter
A client-side
filter interaction specifies that when the dashboard user selects
a specific value in the source indicator, data in the target indicator
is filtered, based on the selection.
Note: Do not specify
a default value for the mapped parameters that severely limits the
amount of data returned by the indicator data. This limited data,
when filtered further by the client-side filter, can reduce the amount
of data to few, or no, matching rows.
All display
types can be the source for a client-side filter interaction, except
dynamic text and the interactive displays.
All display
types can be the target for a client-side filter interaction, except
KPI and the interactive displays.
A client-side
filter operates on data that is stored on the dashboard user's computer,
so a client-side filter can operate against any target parameter,
and a client-side filter can be very responsive. However, because
a client-side filter requires that a target indicator first load all
data on to the dashboard user's computer, load times might be long,
and there is an upper limit to how much data can be used.
Server-Side Filter
Overview
A server-side
filter is conceptually the same as a client-side filter, except that
the parameters are put into the query and the query is sent to the
middle tier (the server) with the new parameters. Generally, a server-side
filter is not as responsive as a client-side filter because of the
time required to communicate with the middle tier, and the target
parameters can be only parameters that are understood by the query.
Unlike
a client-side filter, which can be based on a target parameter that
does not have a prompt defined in the target indicator data, a server-side
filter can be based only on a target parameter that is defined in
the target indicator data.
The only
indicator data that can be used with a server-side filter is an information
map or a stored process. In both cases, you must supply a default
value for a prompt.
All display
types can be the source for a server-side filter interaction, except
dynamic text and the interactive displays.
All display
types can be the target for a server-side filter interaction, except
dynamic text and the interactive displays. The only indicator data
that can be the target for a server-side filter is a relational information
map and a stored process. In both cases, you must supply a default
value for a prompt. An information map must also have at least one
filter defined, and this filter must be a mapped parameter.