| Hypothesis Tests |
Paired t-test
The Paired t-test enables you to determine whether the means of paired samples are equal. The term paired means that there is a correspondence between observations from each population. For example, the birth and death data analyzed in the preceding section are considered to be paired data because, in each observation, the variables birth and death correspond to the same state.
Suppose that you want to determine whether the means for the birth rate and the infant mortality rate are equal. Analyst provides the Two-Sample Paired t-test for Means task, which tests the equality of means of two paired samples. The two samples in this example are the birth rate (birth) and the infant mortality rate (death) for each state.
Open the Bthdth92 Data Set
The data are provided in the Analyst Sample Library. To access this Analyst sample data set, follow these steps:- Select Tools
 Sample Data ...
 - Select Bthdth92.
- Click OK to create the sample data set in your Sasuser directory.
- Select File Open By SAS Name ...
- Select Sasuser from the list of Libraries.
- Select Bthdth92 from the list of members.
- Click OK to bring the Bthdth92 data set into the data table.
Request a Paired t-Test
To perform this analysis, follow these steps:- Select Statistics Hypothesis Tests Two-Sample Paired t-test for Means ...
- Select the variable birth as the Group 1 variable.
- Select the variable death as the Group 2 variable.
The test of interest is whether the difference of the means is zero. This is the default value in Analyst, although you can specify other values as well.
You can choose one of three alternative hypotheses. The default is that the difference between the means is not equal to the specified difference, which is the two-sided alternative. The one-sided alternatives are that the difference is greater than, or less than, the difference specified in the null hypothesis.
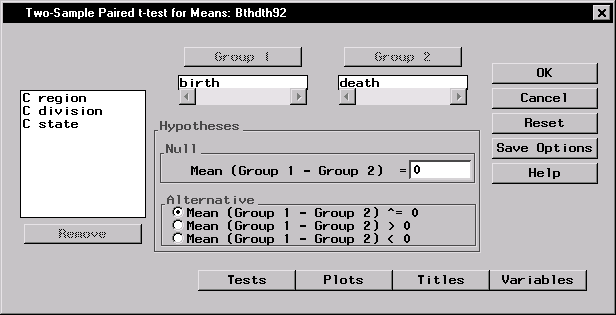 |
Figure 8.7: Paired t-test Dialog
In Figure 8.7, the null hypothesis specifies that the means of the variables birth and death are equal (or, equivalently, that the difference between the means is 0). The alternative hypothesis is that the two means are not equal.
Request Plots
To specify a box-and-whisker plot and a means plot in addition to the hypothesis test, follow these steps:- Click on the Plots button in the main dialog.
- Select Box-&-whisker plot.
- Select Means plot.
- Click OK.
Figure 8.8 displays the Plots dialog with Box-&-whisker plot and Means plot selected.
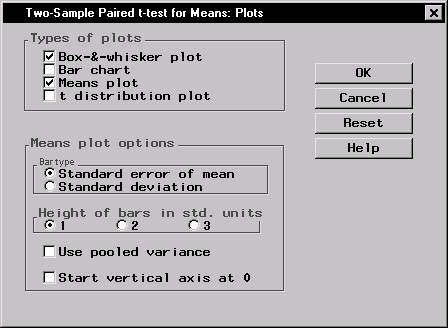 |
Figure 8.8: Paired t-test: Plots Dialog
Click OK in the main dialog to perform the analysis.
Review the Results
The results of the analysis, displayed in Figure 8.9, contain the mean, standard deviation, and standard error of the mean for both variables. The "Hypothesis Test" table provides the observed t statistic, the degrees of freedom, and the associated p-value of the test.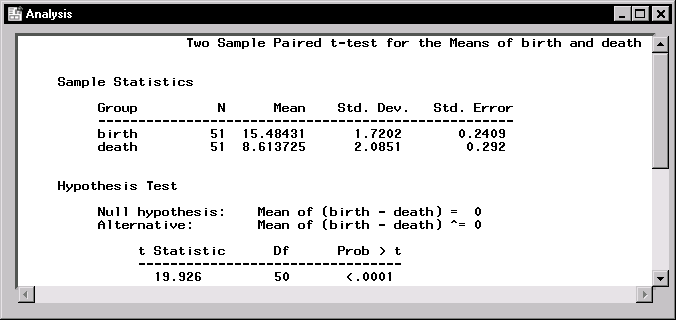 |
Figure 8.9: Paired t-test: Results
In Figure 8.9, the "Sample Statistics" table shows that the mean of the variable birth is larger than that of the variable death. In the "Hypothesis Test" table, the t statistic (19.926) and associated p-value (< 0.0001) indicate that the difference between the two means is statistically very significant.
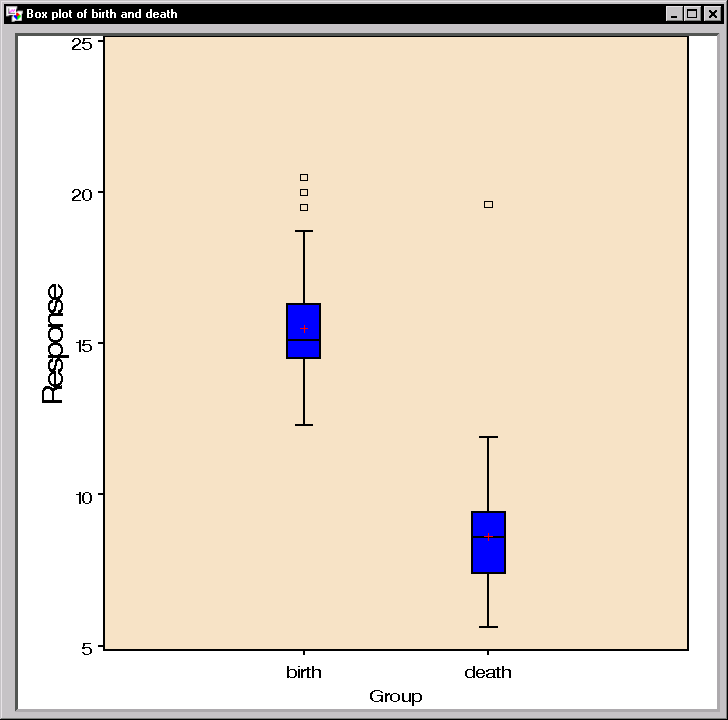 |
Figure 8.10: Paired t-test: Box-and-Whisker Plot
Figure 8.10 displays the side-by-side box plots of birth and death. Observations that fall beyond the whiskers are individually identified with a square symbol.
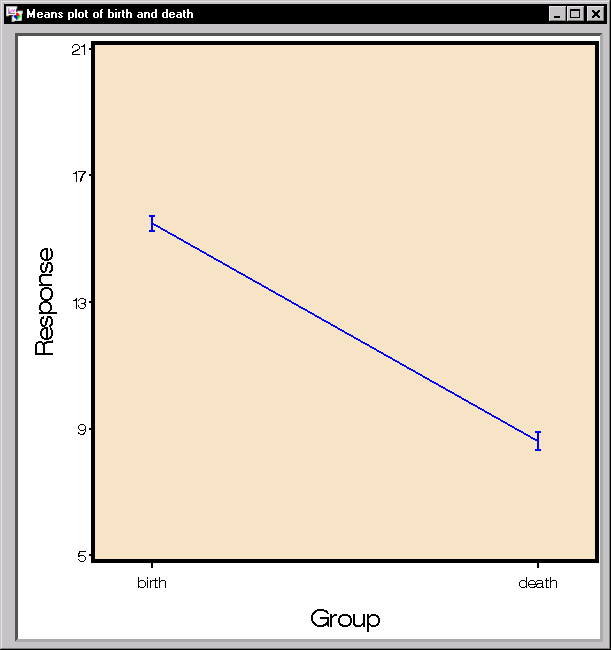 |
Figure 8.11: Paired t-test: Means Plot
The means and standard error plot displayed in Figure 8.11 provides another view of the two variables. The means plot depicts an interval centered on the sample mean for each variable. The vertical line interval extends two standard deviations on either side of the mean.
Copyright © 2007 by SAS Institute Inc., Cary, NC, USA. All rights reserved.