| Descriptive Statistics |
Computing Summary Statistics
In this task, summary statistics (such as the mean, standard deviation, and minimum and maximum values) are desired for the birth and infant mortality rates for each region. In addition, box-and-whisker plots are requested.
Request Summary Statistics
To request the Summary Statistics task, follow these steps:- Select Statistics
 Descriptive Summary Statistics...
 - Select the analysis variables birth and death from the candidate list.
You can specify a classification variable to define groups within your data. When you specify a classification variable, the Analyst Application produces summary statistics for the analysis variables at each level of the classification variable.
- Select region as the classification variable.
Figure 7.7 displays the Summary Statistics main dialog with birth and death specified as the analysis variables and region specified as the classification variable.
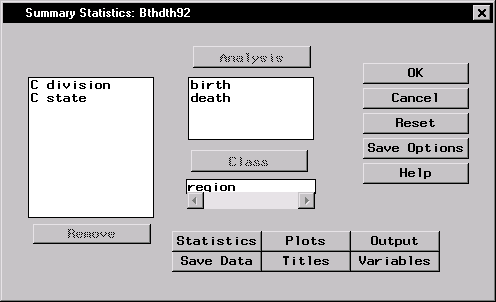 |
Figure 7.7: Summary Statistics Dialog
Request Box-and-Whisker Plots
To request box-and-whisker plots, follow these steps:- Click on the Plots button.
- Select Box-&-whisker plot.
- Click OK.
Figure 7.8 displays the Plots dialog with Box-&-whisker plot selected.
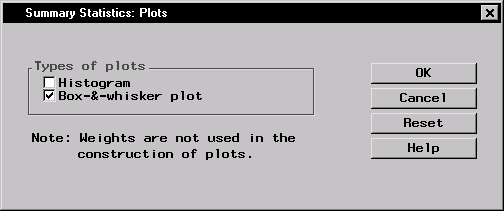 |
Figure 7.8: Summary Statistics: Plots Dialog
To perform the analysis, click OK in the main dialog.
Review the Results
The results are presented in the project tree under the Summary Statistics folder, as displayed in Figure 7.9. The four icons represent the summary statistics output, the box-and-whisker plots for each analysis variable, and the SAS programming statements (labeled Code) that generate the output.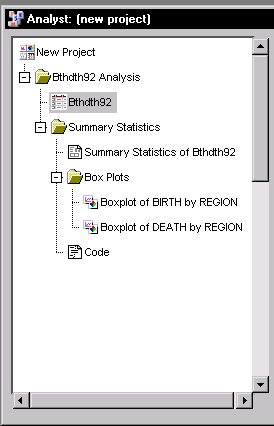 |
Figure 7.9: Summary Statistics: Project Tree
Double-click on any of the icons to display the corresponding information in a separate window.
Figure 7.10 displays, for each value of the classification variable region, the number of observations, the mean, the standard deviation, and the minimum and maximum values of each analysis variable. The western region has the highest birth rate (16.89) and the southern region has the highest death rate (10.15).
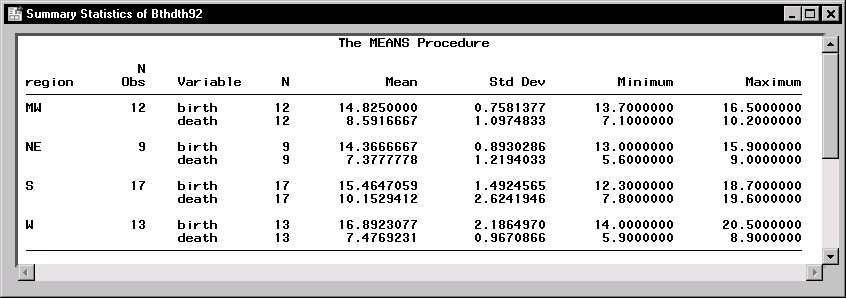 |
Figure 7.10: Summary Statistics: Statistics for birth and death
Figure 7.11 displays the box-and-whisker plot for the variable birth for each level of the region variable.
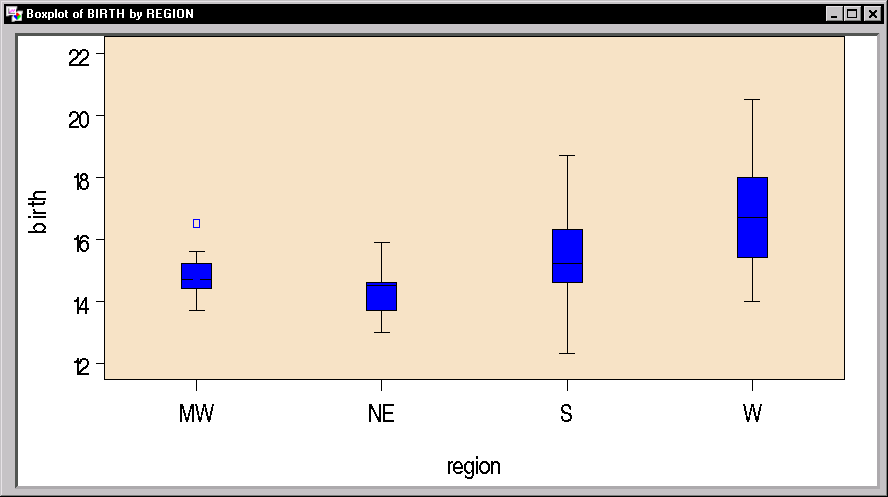 |
Figure 7.11: Summary Statistics: Box-and-Whisker Plot for Birth Rate by Region
This plot reveals a possible outlier in the birth rate for the midwestern region (region=`MW'). The western region (region=`W') is noticeable as the region with the highest birth rate.
Copyright © 2007 by SAS Institute Inc., Cary, NC, USA. All rights reserved.