| Customizing Your Session |
Point Display Options
Point display options control the display of points and lines in plots. You can select the color, symbol type, and symbol height of points displayed in the plot. You can also control the color and width of lines in the plot.
Click on the Color button to change the color selected to display points.
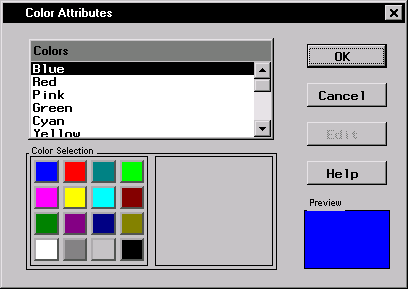 |
Figure 4.6: Color Attributes Dialog
Click on the arrow next to Symbol: to select the symbol used to display points.
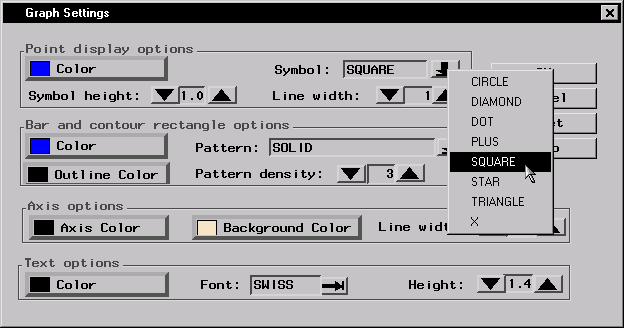 |
Figure 4.7: Point Symbols
Click on the down or up arrow next to Symbol height: to change the size of the symbol.
Click on the down or up arrow next to Line width: to change the width of lines displayed in the plot.
Copyright © 2007 by SAS Institute Inc., Cary, NC, USA. All rights reserved.