| Customizing Your Session |
Output Settings
In the Output tab, you can specify options for multiple output, graphs, source code, and HTML files.
 |
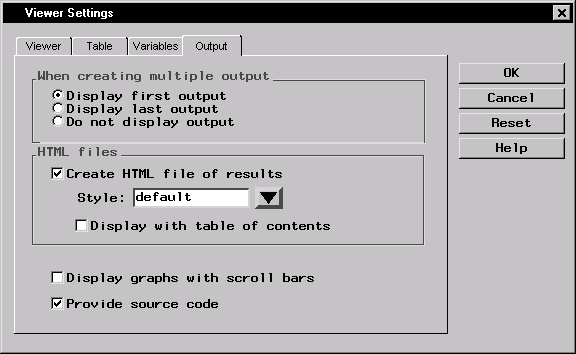
Figure 4.4: Viewer Settings Dialog,Output Tab
Under When creating multiple output, you can determine whether the first or last output should be displayed automatically when an analysis has been run, or whether output should be displayed at all.
Under HTML files, select Create HTML file of results to include an HTML output node in your project tree whenever you apply a task to your data. You can change the style of the HTML output by selecting a style from the Style: drop-down menu. Select Display with table of contents to view the HTML output using a table of links to your output (displayed with HTML frames). If this option is not selected, all results are displayed in a single page.
Select Display graphs with scroll bars to display scroll bars with your graphs. When scrollbars are displayed, graphs are shown in their natural size. When scrollbars are turned off, graphs are shown in full size in the Output window. Scrollbars can also be turned on or off in the Output window.
Select Provide source code to include a source code node in your project tree whenever you apply a task to your data.
Copyright © 2007 by SAS Institute Inc., Cary, NC, USA. All rights reserved.