| Split-Plot Designs |
Exploring Response Data
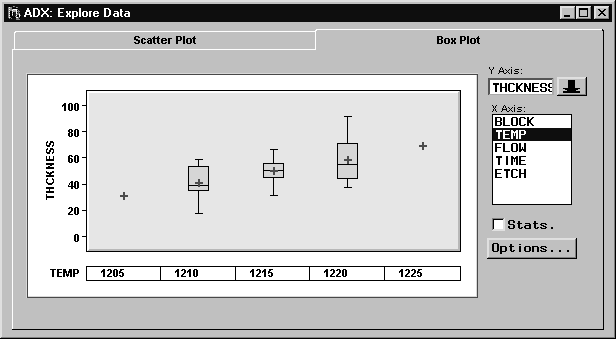
Before fitting a mixed model, click Explore in the main design window. Both box plots and scatter plots are available. Box plots help you visualize the differences in response distribution across levels of different factors, both random and fixed. Scatter plots show the individual responses broken down by factor level or run and can also be used to investigate time dependence.
The box plot is the first graph that is displayed. You can explore the distribution of the response broken down by each of the factors or batches that make up the whole plot.
|
Close the window to return to the main design window.
Copyright © 2008 by SAS Institute Inc., Cary, NC, USA. All rights reserved.