Charting IMS Data
GCHART procedure programs work with data that is described by view descriptors
just
as they do with other SAS data sets. The following example creates a horizontal bar
chart of the number of checking account withdrawals per day. This example uses the
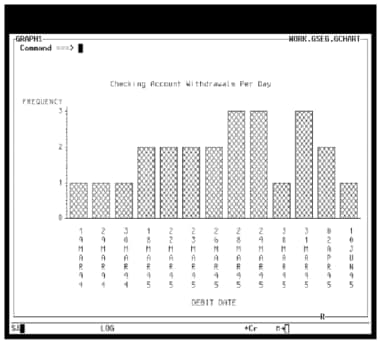
view descriptor Vlib.CdbtDate to describe the CHCKDEBT segment of the AcctDBD database:
options nodate linesize=132;
goptions device=chardrvw;

proc gchart data=vlib.cdbtdate;
   vbar check_date / discrete;
   title2 'Checking Account Withdrawals Per Day';
run;
The following figure
shows the output for this example. CDBTDATE represents the date of
each checking account withdrawal; the number of checking account withdrawals
is represented by the length of the bar. For more information about
the GCHART procedure, see SAS Language Reference: Concepts and the
SAS/GRAPH: Reference.
If you have
SAS/GRAPH software, you can create colored block
charts, plots, and other graphics based on IMS data. See SAS/GRAPH: Reference for more information about the types of graphics
that you can produce with this SAS product.
Copyright © SAS Institute Inc. All rights reserved.